Figure 5.
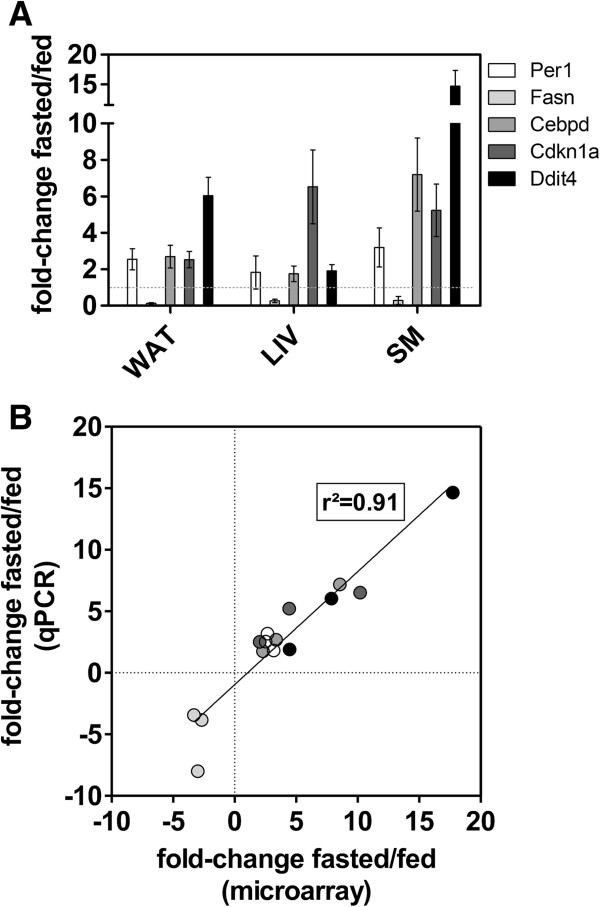
Validation of selected candidates by qPCR. (A) Five genes differentially regulated in WAT, LIV, and SM were selected for qPCR validation of microarray results (n = 5). All differences indicated between fasted and control fed are significant with a p-value < 0.05 (two-tailed, unpaired student’s t-test). (B) Scatterplot of expression levels measured with qPCR and microarrays. Goodness of fit (r2) is calculated with linear regression. Grey shading is according to legend in A.

