
Fig. 1.


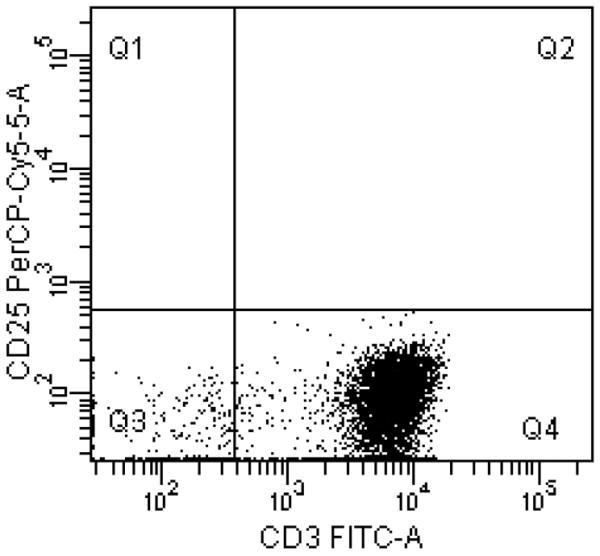

A, Surface expressions of CD1a, Langerin, and E-cadherin (solid lines) demonstrate successful conversion of monocytes into LCs. Dotted lines represent staining with isotype controls. B, A representative example of purified CD3+CD25−T-cell population in Q4 with purity of 95.1%. C, T-cell proliferation measured using alamarBlue. The mean of six replicates from each individual subject is plotted. The bar represents the mean of the group. P values were calculated using paired t-test.