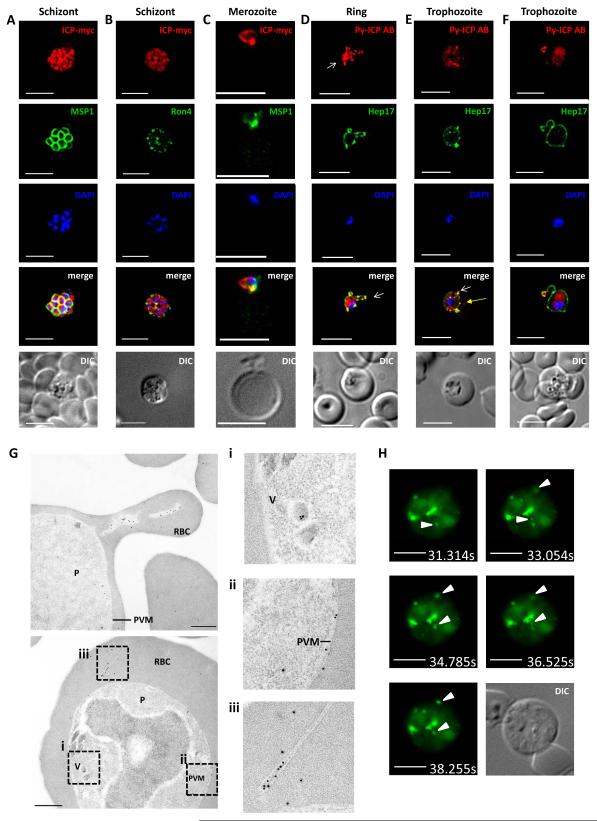
Figure 2. Py-ICP expression and localization in blood stages.
The expression of ICP in blood stages was visualized using IFA (A-F), immunoelectron microscopy (IEM) (G), and live fluorescent microscopy (H). (A, B) Py-ICP-myc schizonts were imaged with antibodies to c-myc (red), MSP1 (A, green) or the rhoptry neck marker RON4 (B, green). (C) Py-ICP-myc merozoite invading an erythrocyte. Merozoites were stained with antibodies against c-myc (red) and MSP1 (green). (D thru F) WT blood stage parasites at the ring (D) or trophozoite (E-F) developmental stages were imaged with antibodies to Py-ICP (red) and the PVM marker Hep17 (green). Vesicular structures associated with the PV (Hep17 positive) are indicated by white arrows (D-F), or in Hep17-negative structures with yellow arrow in (E). DNA was imaged with DAPI. Scale bar: 5 μm. (G) IEM of Py-ICP in erythrocytes infected with Py WT parasites. Areas in (F) were magnified 2.5x (dashed box) to show details of ICP localization in parasite-internal vesicles (i), in the PV (ii) and in exomembrane structures within the infected erythrocyte (iii). Scale bar: 500 nm. (H) Live imaging was used to visualize the GFP signal from Py-ICP-RFA in infected erythrocytes. In addition to the GFP signal, DIC images were collected from the same z-stack. Pictures are time stamped and arrows indicate highly mobile ICP-positive punctate structures. Scale bars: 5 μm. Supplemental Movies 1 and 2 show the mobile structures.

