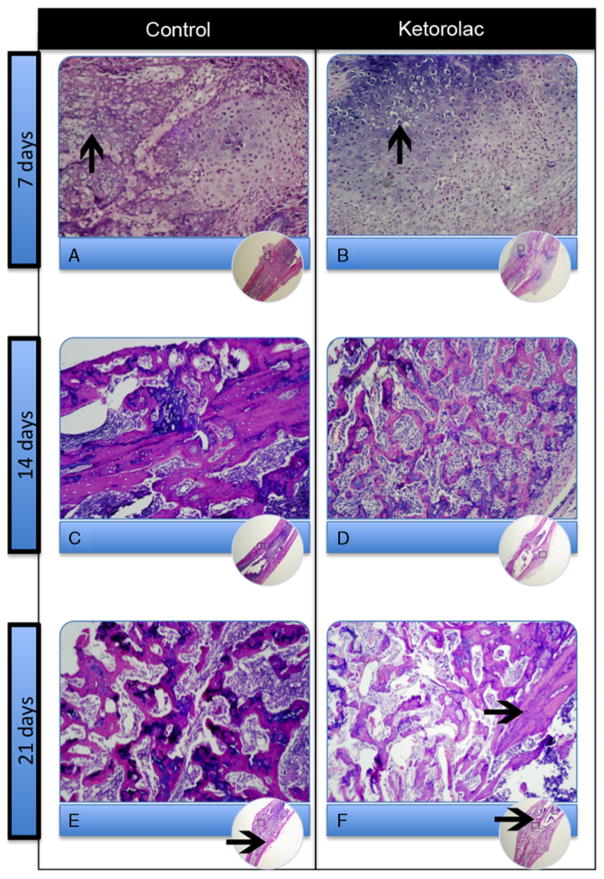
FIGURE 4.
Images of hematoxylin and eosin-stained specimens of the fractured tibiae at each time point comparing the saline control groups and ketorolac treatment groups. Hypertrophied chondrocytes (arrows in A and B) at day 7; woven bone at day 14 (C and D); further woven bone and early compact lamellar bone (arrows in E and F) at day 21.

