
Figure 2.
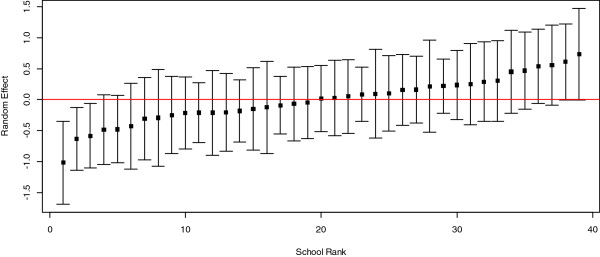
Variation in knowledge level by school, illustrated by the posterior empirical bayes estimates of the random effects for each school rank (squares), with their 95%confidence intervals. Red horizontal line indicates the level for the average school; if an interval does not intersect with the red line, the corresponding school differs significantly from the average.