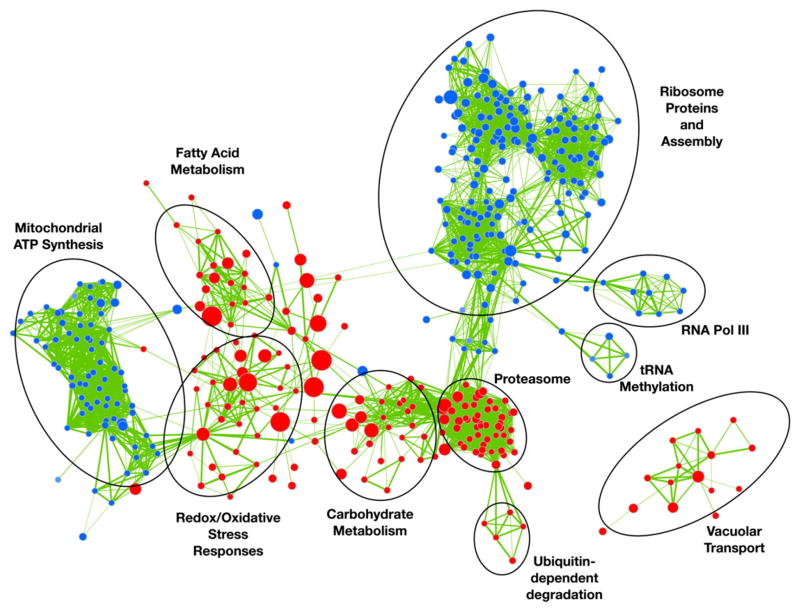
Fig. 1.
Enrichment Map of Sko1-dependent osmotic stress-responsive genes. Enrichment Map based on transcript profiles comparing the sko1Δ/Δ mutant strain (JMR104) against the wt reference strain (DAY185) following 1.0 M NaCl treatment. Nodes (circles) depict gene sets statistically overrepresented in the sko1Δ/Δ mutant strain, and node size represents the number of genes in a set. Red node color represents enrichment in the sko1Δ/Δ mutant strain (genes repressed by Sko1 under osmotic stress). Blue node color represents enrichment in the wt strain (genes activated by Sko1 under osmotic stress). Color intensity is proportional to the enrichment significance. Lines (edges) connecting nodes indicate the relatedness between nodes. Edge thickness represents the degree of overlap between gene sets.

