
Figure 4.
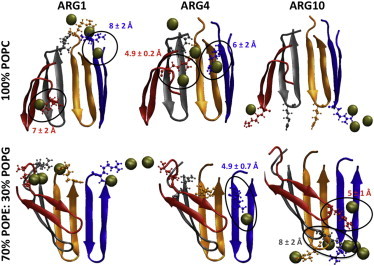
Protegrin arc structures at 300 ns (cartoon representation) of the simulations starting from preformed pores. ARG1, ARG4, and ARG10 are represented by balls-and-sticks. The P atoms of lipid headgroups that are within 7 Å of the arginine side-chain guanidine N atoms are shown using tan-colored spheres. Black circles highlight the interactions between arginines and P headgroup atoms that are lining the pore (|z| ≤ 8.5 Å). In these cases, the average minimum distance between arginine Cζ and pore lining P atoms is indicated (see Table S3). To see this figure in color, go online.