
Figure 3.
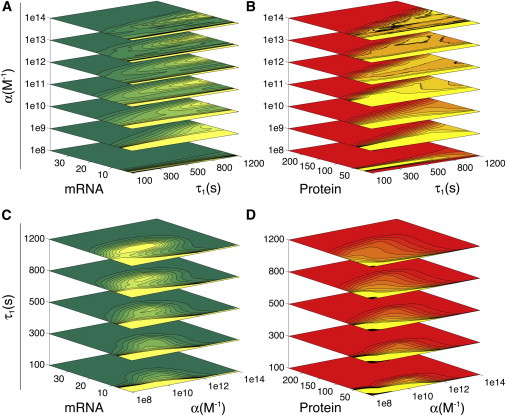
Stacked contoured PDFs reveal a stochastic Hopf bifurcation. Contour slices were calculated for different feedback strengths (A, B), and different transcription delay values (C, D). Stacks for mRNA (A, C) and protein (B, D) are shown. Lighter colors correspond to local maxima in the PDFs. From bottom to top, within each panel, contoured PDFs approach a bimodal shape. The uppermost contours in the top panels (A, B) look less smooth as the burst regime appears beyond α = 1012 M−1.