
Figure 2.
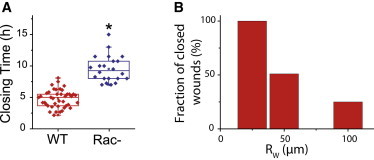
Effect of Rac1-inhibitor on closure dynamics. (A) Closure time (Rw = 50 μm) in MDCK wild-type (red) and Rac− (blue) assay. Rectangular boxes show the first quartile, the median, and the last quartile. (B) Rac− assay, fraction of MDCK wounds proceeding to full closure within 18 h for initial sizes of Rw = 25 μm (N = 8), Rw = 50 μm (N = 39), and Rw = 100 μm (N = 16). To see this figure in color, go online.