
Figure 3.
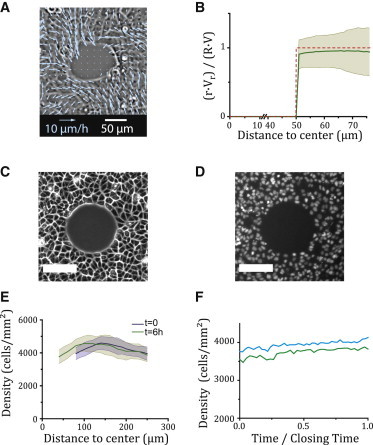
Measurements at the scale of the epithelium. (A) Snapshot of the epithelial velocity field (wild-type MDCK wound, Rw = 50 μm, t = 1 h). (B) Plot of the ensemble-averaged ratio versus radius, r (solid green line, N = 21), where Vr is the angle-averaged radial velocity component, and R(t) and V(t) = (t), respectively denote the effective margin radius and velocity. The shaded area gives the mean ± SD. The radial velocity profile of an incompressible epithelial flow reads rVr(r,t)/(R(t)V(t)) = 1 (Eq. S5), plotted as a dashed red line for comparison. (C and D) Phase-contrast (C) and epifluorescence (D) views of MDCK cells expressing histone-mCherry. Scale bar, 100 μm, Rw = 75 μm. (E) Radial cell density profile at t = 0 h and t = 6 h. The shaded areas give the mean ± SD. (F) Plot of the mean cell density in the entire field of view as a function of time for two wounds (Rw = 75 μm). The relative increase in density is of the order of 10% during closure.