
Figure 4.
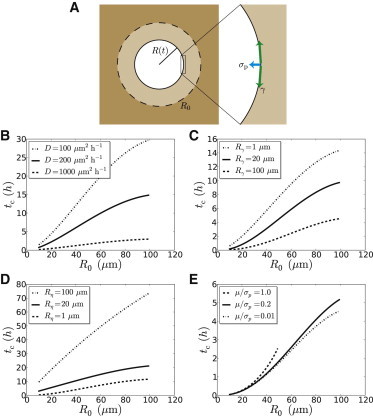
Physical model of epithelial closure. (A) Sketch of a closing circular wound, of initial radius R0 = R(t = 0). Two border forces may drive closure: σp is the protrusive stress produced by lamellipodia and γ the line tension due to the contractile circumferential cable (see the stress boundary condition (Eq. S4)). (B–F) Model predictions. Plots of the closure time, tc, as a function of the initial effective radius, R0. (B) Effect of the variation of D while Rmax = 110 μm is fixed, inviscid rheology without cable (Eqs. 1 and S27). (C) Effect of the variation of Rγ = γ/σp while D = 200 μm2 h−1 and Rmax = 110 μm are fixed, inviscid rheology with a cable (Eq. S28). (D) Effect of the variation of while D = 200 μm2 h−1, Rmax = 110 μm, and Rγ = 10 μm are fixed, viscous rheology (Eq. S29). (E) Effect of the variation of μ/σp while D = 200 μm2 h−1, Rmax = 110 μm, and Rγ = 100 μm are fixed, elastic rheology (Eq. S30). When μ/σp = 1, closure is complete and characterized by a finite closure time only below a value of R0 above which elastic forces are strong enough to stop epithelization. To see this figure in color, go online.