
Figure 4.
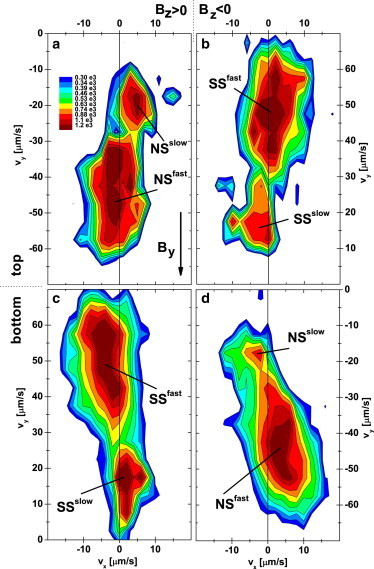
Swimming velocity distribution of cells swimming close to the top (a and b) and bottom walls (c and d) with horizontal field mT. The vertical fields were mT (a and c) and mT (b and d). To see this figure in color, go online.
Official websites use .gov
A
.gov website belongs to an official
government organization in the United States.
Secure .gov websites use HTTPS
A lock (
) or https:// means you've safely
connected to the .gov website. Share sensitive
information only on official, secure websites.
Swimming velocity distribution of cells swimming close to the top (a and b) and bottom walls (c and d) with horizontal field mT. The vertical fields were mT (a and c) and mT (b and d). To see this figure in color, go online.