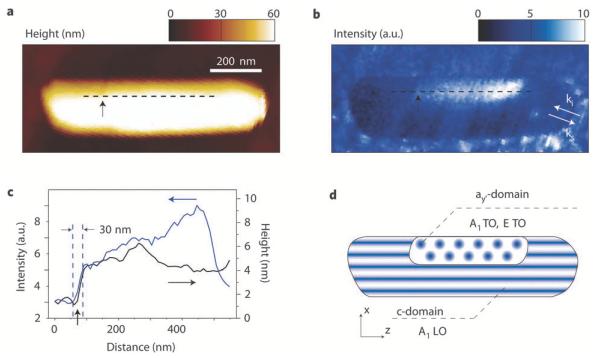
Fig. 9.
Spatially resolved TERS for ferroelectric domain imaging. (a) Topography of a BaTiO3 nanorod. (b) The spectrally integrated TERS signal for ferroelectric domain imaging. (c) Lateral cross section along the dashed lines in a and b of the region of high TERS signal (blue) and corresponding topography (black) on the rod. (d) Domain assignment based on the Raman selection rules for the TERS geometry used (figure reproduced with permission from ref. 117, ©2009 NPG.).

