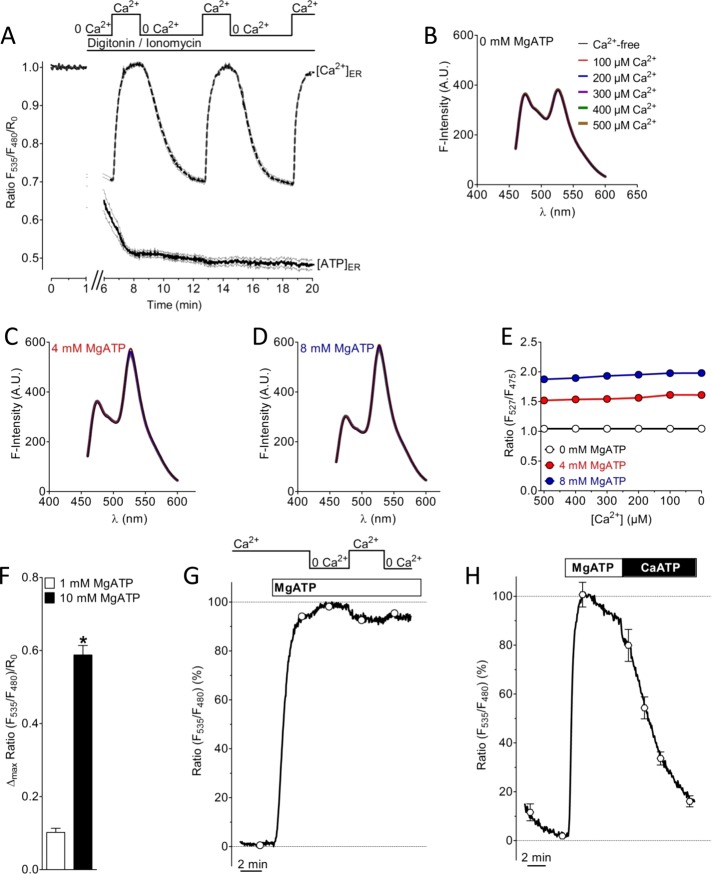
FIGURE 4:
Characterization of the effect of Ca2+ on the ATP probe in permeabilized cells and in vitro. (A) The effect of Ca2+ on ERAT4.01 signals was evaluated in cells permeabilized with 10 μM ionomycin in the presence of 10 μM digitonin. In permeabilized cells multiple Ca2+elevations (2 mM Ca2+) in the absence of ATP do not affect the FRET signal of ERAT4.01 (solid curve). [Ca2+]ER was detected with D1ER (dotted curve). (B) Fluorescence spectra of the purified ER ATP probe without MgATP and in the presence of different Ca2+ concentrations as indicated. (C) Fluorescence spectra of the purified ER ATP probe in the presence of 4 mM MgATP and in the presence of different Ca2+ concentrations as indicated in B. (D) Fluorescence spectra of the purified ER ATP probe in the presence of 8 mM MgATP and in the presence of different Ca2+ concentrations as indicated in B. (E) ATP-dependent changes of the emission ratio of the purified ATP probe in vitro vs. the Ca2+ concentration. (F) Normalized FRET ratio changes of ERAT4.01 in permeabilized cells upon the addition of 1 mM Mg ATP (white column, n = 12) and 10 mM Mg ATP (black column, n = 20). Respective changes of the fluorescence of the donor and FRET channel are presented in Supplemental Figure S4A. (G) Representative curve representing normalized ratio signals of ERAT4.01 in permeabilized HeLa cells in response to 10 mM MgATP and the subsequent addition and removal of 2 mM Ca2+. For statistical data see Supplemental Figure S4B. (H) Effect of a switch from 10 mM MgATP to 10 mM CaATP in permeabilized HeLa cells. The average curve was normalized to the maximal ratio signal, which was obtained by the addition of 10 mM MgATP (n = 4).

