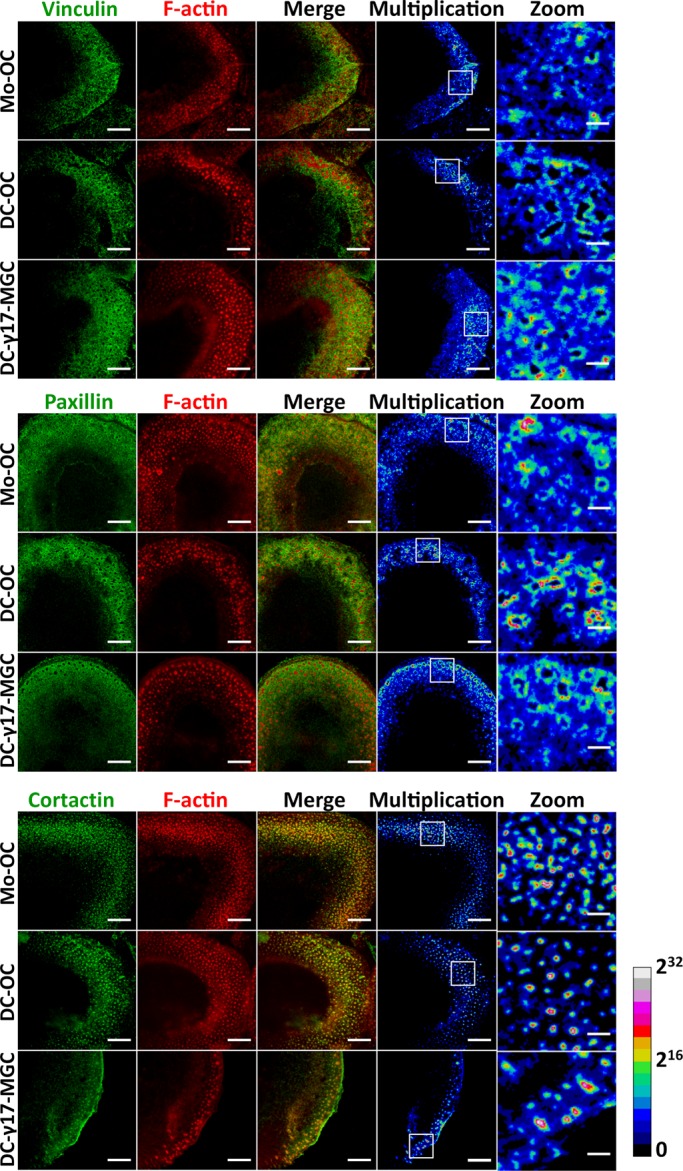
FIGURE 2:

Cytoskeleton organization in DC-17γ-MGC compared with Mos and DC-OCs. Cells seeded on glass showing colocalization of paxillin or vinculin (green) with F-actin (red) at the podosome cloud (top and middle, respectively) and cortactin (green) with F-actin (red) at the podosome core. Multiplication images here calculated pixel to pixel from F-actin combined with one podosomal protein at a time and are represented in 32-bit float images with a ratio lookup table. The calibration bar indicates the correspondence of false color to 32-bit pixel fluorescence intensities. Scale bar, 10 μm (first four columns), 2 μm (magnified square insets).
