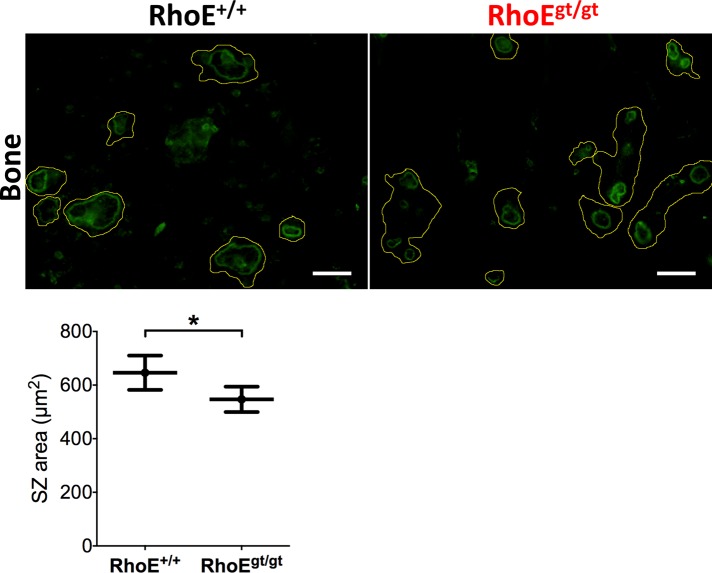
FIGURE 5:
RhoEgt/gt OCs exhibit smaller SZs. Micrographs of F-actin–stained FL-OCs seeded on cortical bone slices showing smaller SZs sizes. Yellow lines show cell periphery inferred from overcontrasted images. SZs were determined by their circular shape and strong fluorescence. SZ outlines were manually drawn, and inner surface areas were quantified. Calculated mean ± SEM is plotted. Scale bar, 50 μm.

