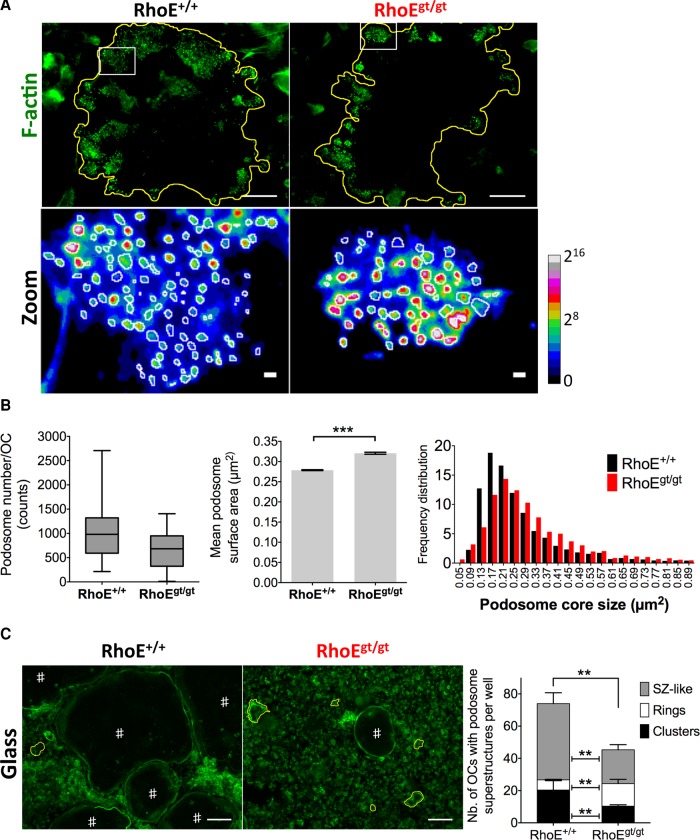
FIGURE 6:
Podosome size, number, and collective patterning are regulated by RhoE in OCs. (A) Top, micrographs of BM-OC podosomes stained for F-actin, showing reduced number of podosomes in RhoEgt/gt OCs. The yellow line in the zoomed images (bottom) shows cell periphery (top). Bottom, zoom of white insets in top lane using ratio lookup table colors. White circles depict peripheries of podosome cores as identified by local intensity thresholds using ImageJ (see Materials and Methods) followed by manual curating. The calibration bar indicates the correspondence of false color to 16-bit pixel fluorescence intensities (B) Left, whisker-box plot depicts minimum and maximum number of podosomes per cell (whiskers), 25 and 75% quartiles (lower and upper limits of boxes), and median (midline of boxes). Middle, histogram showing mean podosome core size with SEM bars. Left, frequency distribution histogram of podosome core sizes, showing a shift toward bigger sizes in RhoEgt/gt OCs. Horizontal axis shows the centers of intervals. (C) Micrographs of F-actin–stained FL-OC cultures. #iOCs with SZ-like patterns. SZ-like patterns are several hundred micrometers in diameter and delineate the cell periphery. The yellow lines outline OCs that have podosome rings. Rings, similar to SZ-like patterns, are also circular superstructures but are only tens of micrometers in diameter. Histogram shows counts of clusters, rings. and SZ-like patterns per well. Note the decrease in RhoEgt/gt OCs in stable and metastable podosome superstructures, that is, clusters and SZ-like patterns, respectively, as well as the increase of transient superstructures, that is, rings. Scale bar, 100 μm.

