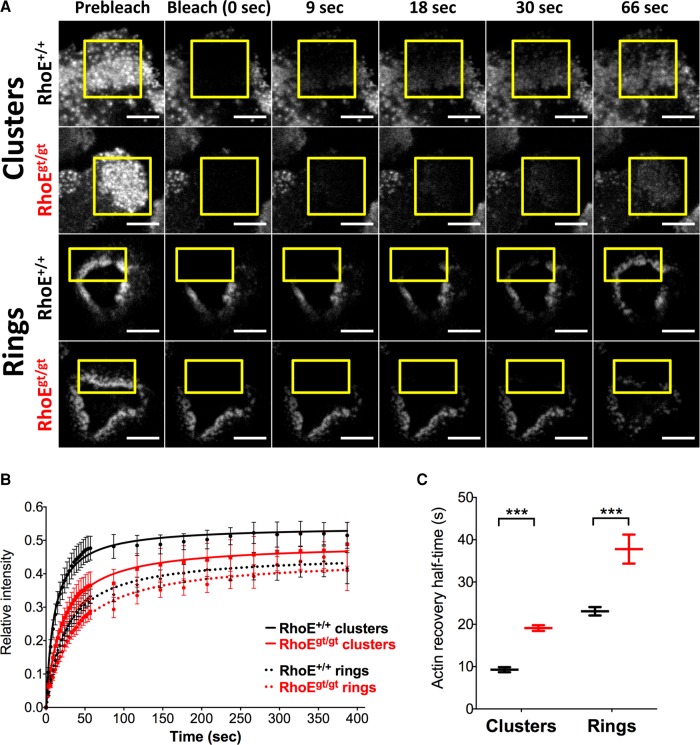
FIGURE 7:
FRAP of LifeAct-mCherry reveals slower turnover in podosome clusters and rings in RhoEgt/gt OCs. (A) Micrographs of time frames pre- and postphotobleaching of LifeAct-mCherry–expressing FL-OCs on day 6. Yellow insets show bleached areas. Scale bar, 10 μm. (B) Mean fluorescence recovery of photobleached areas normalized to mean fluorescence of the same area before photobleaching and to the nonbleached remainder of the cell during recovery. Data were gathered from n > 12 samples per genotype and per structure from two independent cultures. Each culture was differentiated using a pool of precursors from at least three animals of the same genotype. Dots are means of mean relative fluorescence. Lines are fitted curves. Bars are SD. (C) F-actin recovery half-times calculated from recovery curves. Recovery half-times are increased in clusters from 9.8 ± 1.4 s in RhoE+/+ to 19.7 ± 3.5 s in RhoEgt/gt OCs and in rings from 24 ± 3 s in RhoE+/+ to 34.4 ± 3.8 s in RhoEgt/gt.

