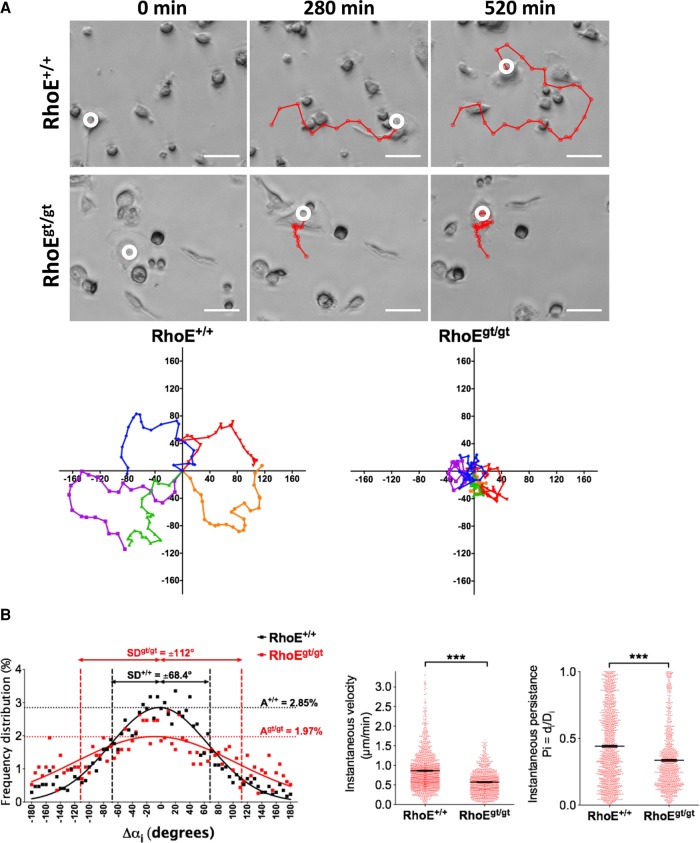
FIGURE 8:
RhoEgt/gt OCs show impaired migration. (A) Top, micrographs of time-lapse imaging showing Sp-OC migration tracks (red). Scale bar, 40 μm. Bottom, representative rose plots of 5 RhoE+/+ and 5 RhoEgt/gt OC migration tracks for a total duration of 8 h/track. (B) Plots of migration parameters of migrating OCs (RhoE+/+, n = 84 tracks, 1870 time points; RhoEgt/gt, n = 39 tracks, 1214 time points). Left, instantaneous velocity of displacement (i.e., speed between two consecutive positions). Middle, instantaneous persistence of OC migration (Pi = di/Di). Right, frequency distribution of angle change between two consecutive movements. Raw values are represented with dots and fitted with a Gaussian function. Error bars are SEM.

