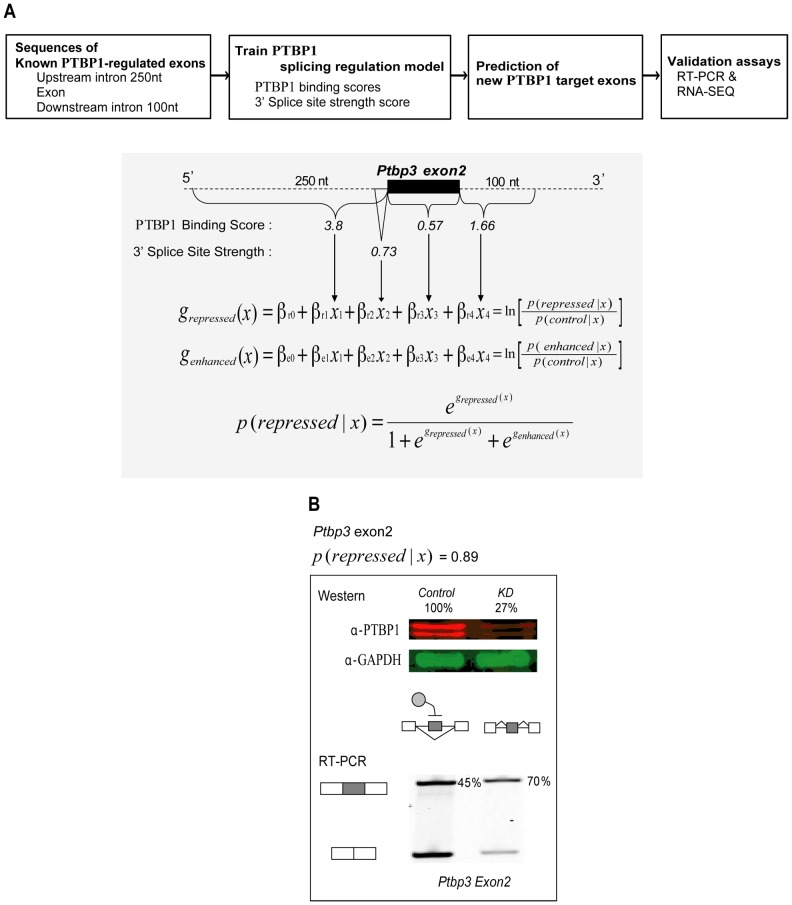
Figure 4. Scheme of the PTBP1 splicing regulation model and its application to an exon in Ptbp3.
A. The PTBP1 splicing regulation model was trained on known PTBP1-regulated and non-regulated exons and used to predict new PTBP1-dependent exons. Prediction results were compared to changes in exon inclusion (PSI) measured by RT-PCR and RNA-seq. An exon from Ptbp3 is presented as a prediction example. From intron and exon sequences, PTBP1 binding scores and 3′ splice site strength were calculated and fed into the regulation model. B. The model predicts exon 2 of Ptbp3 as repressed by PTBP1 with high probability (0.89). Ptbp1 knockdown in mouse neuroblastoma cells (N2A) confirmed de-repression of the exon (from PSI = 45 to PSI = 70).

