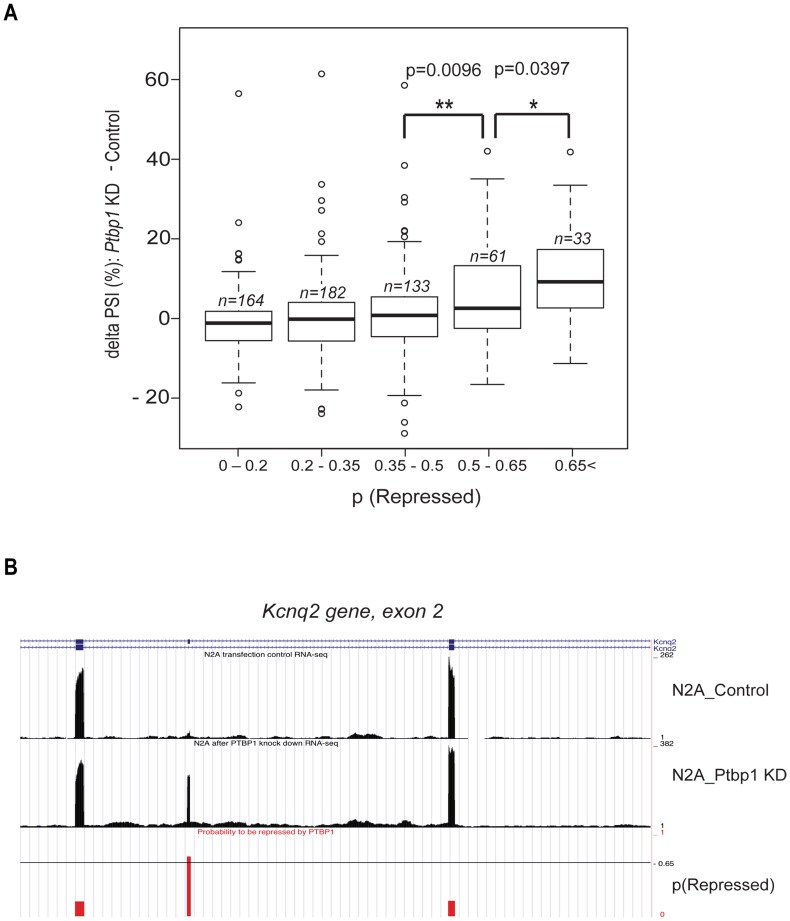
Figure 6. Large-scale validation of novel PTBP1-repressed exons by RNA-seq.
A. Validation of the PTBP1 splicing model using RNA-seq. After Ptbp1 knockdown, we performed RNA-seq experiments and estimated changes in PSI (Percent of Spliced In) for 573 cassette exons. The graph shows average delta PSI values for exons, grouped by their probabilities to be repressed by PTBP1. The number of exons in the corresponding probability bin is given by n. P-values were calculated from one-tailed Student's t-test. B. A genome browser screenshot of a novel PTBP1-regulated exon: exon 2 of the Kcnq2 gene. For whole internal mouse exons, we created custom genome browser tracks to visualize the PTBP1 splicing model and mapped RNA seq reads.

