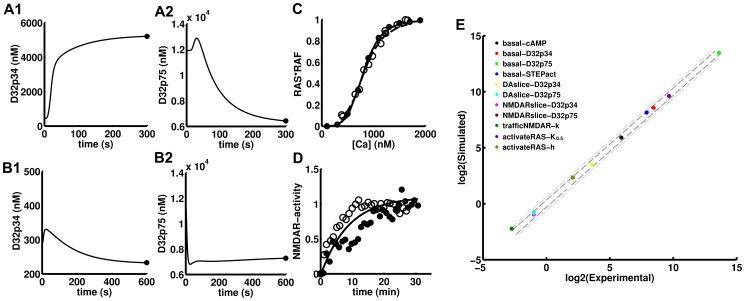
Figure 2. Fitting of the model to non-APA (Acute Psychostimulant Administration) phenotypes (see Table 1).
Experimental values are represented with dots from A to D. A) D32p34 (A1) and D32p75 (A2) in the DAsliceD32 phenotype (sampled at 5′). B) D32p34 (B1) and D32p75 (B2) in the NMDAsliceD32 phenotype (sampled at 10′). C) Dose response of the RAS*RAF complex relative to total RAS in the activateRAS phenotype. The Hill equation was fitted to experimental data (○, dashed line) and simulated data (•, solid line) were fitted to by the Hill equation (dash line) and the Hill coefficient compared. D) Kinetics of NMDAR function enhancement in the trafficNMDAR phenotype. NR2B traffic was induced by DA in prefrontal cortex slices (•) and ethanol in the striatum (○). The mean rate constant and amplitude of a monoexponential fit are reported. The maximum amplitude produced by this mechanism has been found to lie between 1.5 for EPSPs amplitude [60] and about 4 for mEPSPs frequency [61]. E) Simulated versus experimental single time measurements and parameter estimates for all non-APA phenotypes. The dashed lines delimit 20% (dark grey) and 50% (light grey) divergence between experimental and simulated values.

