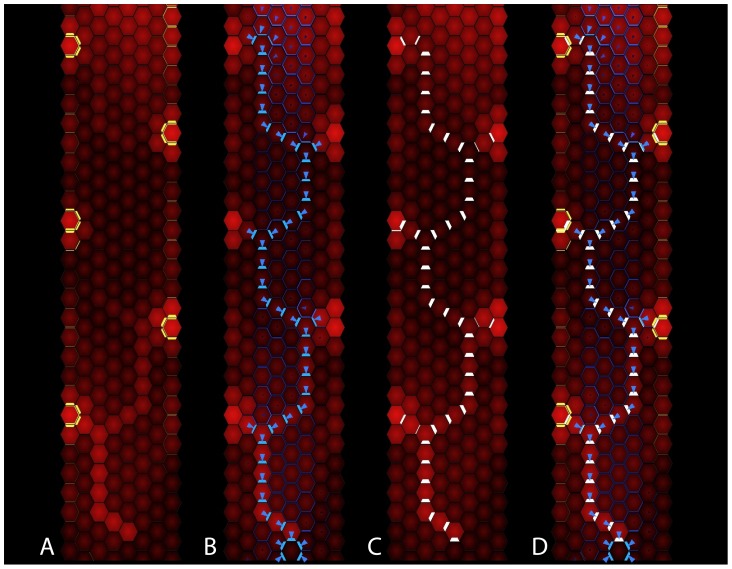
Figure 6. The state of the simulation after the successive emergence of five convergence points.
The concentration of auxin in each cell, PIN on each cell membrane and PIN1b polarities are represented as in Figure 5. (A–C) The expression of each PIN protein: (A) SoPIN1, (B) PIN1b, and (C) PIN1a. (D) The combined expression of the three PINs.

