
Figure 2. Several ONSEN genomic copies contribute to the extrachromosomal DNA.
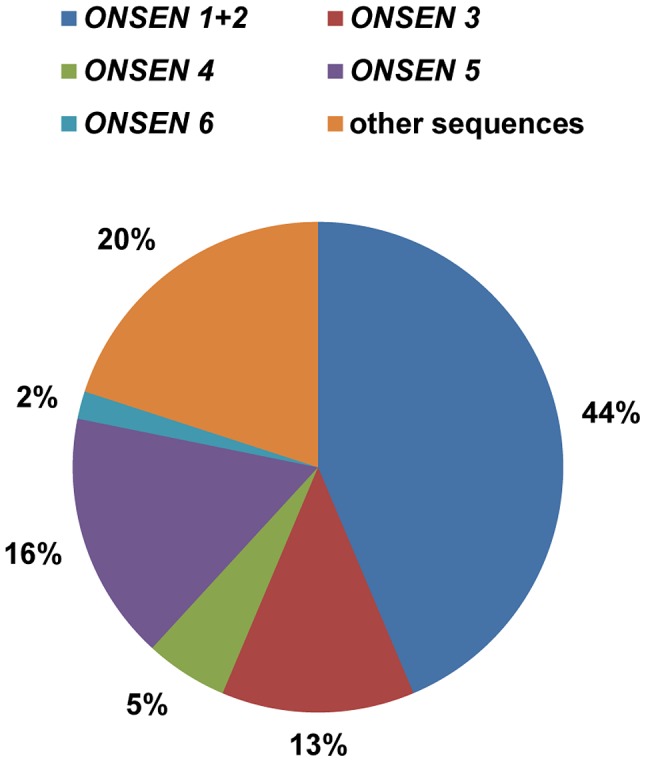
The pie chart indicates the ratio of extrachromosomal ONSEN sequences (n = 55) present after 30 h HS, distinguished by element-specific polymorphisms (color-coded). Polymorphisms are listed in Supplementary Table S1.