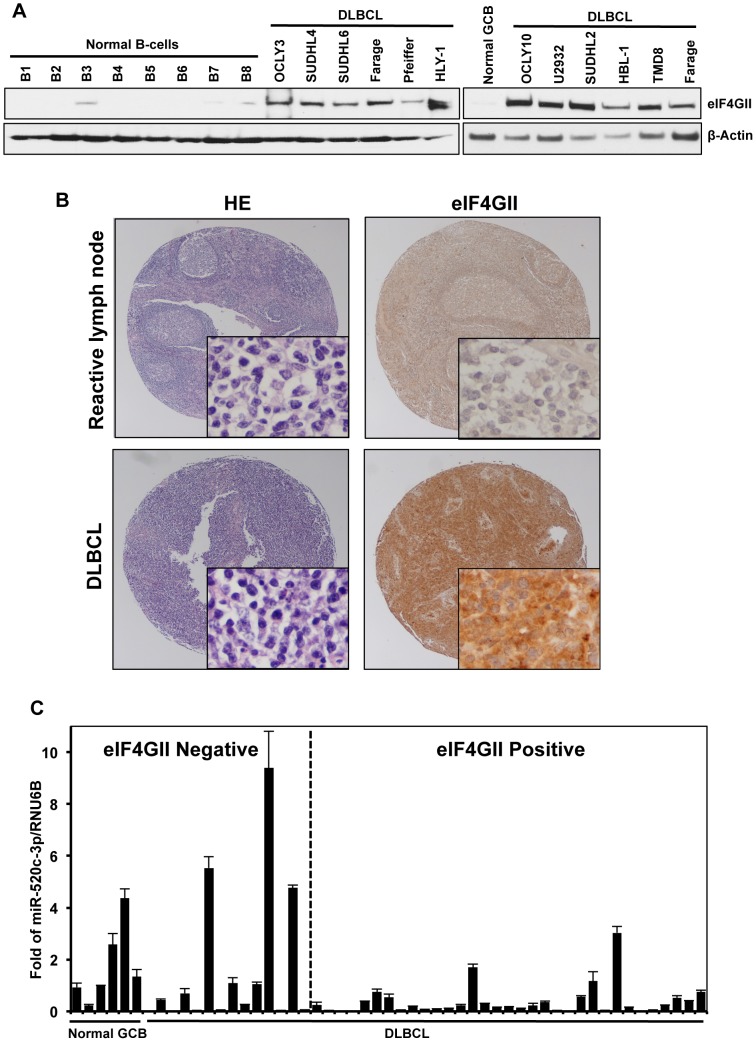
Figure 7. DLBCL cells express high levels of eIF4GII protein and low levels of miR-520c-3p.
(A) eIF4GII protein levels in normal B-cells and DLBCL cells were analyzed by Western blot. β-Actin was used as a loading control. Data are representative of three independent experiments. (B) Pictured are representative fields (20× and 400× magnifications) of germinal center B-cell centroblasts of reactive lymph nodes and DLBCL tissue microarrays immunohistochemically stained with anti-eIF4GII antibody. HE staining was used for morphologic examination. (C) RNA from tissue microarrays used in (B) was purified and expression of miR-520c-3p was measured by RT-qPCR. Graphs represent the means and SEM from repeats of three independent assays.

