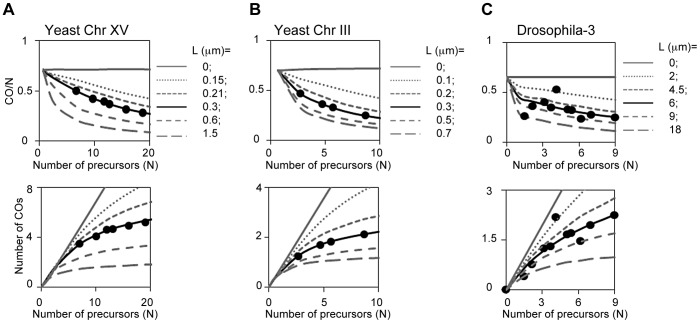
Figure 12. CO homeostasis in yeast, Drosophila, tomato and grasshopper.
(A, B) CO homeostasis relationships were determined experimentally for yeast chromosomes XV and III (text; Figure S7); plotted (filled circles); and compared with the values predicted from BF simulations based on best-fit parameter values for the two chromosomes (L = 0.3 µm, black lines). Predictions for other values of L are shown for comparison (grey lines). Experimental data precisely match BF simulation predictions. (C) CO homeostasis relationships determined experimentally for Drosophila chromosome 3 were compared with the predictions of the corresponding BF simulation (L = 6 µm, black line). Predictions for other values of L are shown for comparison (grey lines). Experimental data precisely match BF simulation predictions. [Note: Drosophila analysis was carried out as follows. Variation in CO number as a function of DSB level was determined experimentally for a fragment of chromosome 3 [34]. We first defined the theoretical CO homeostasis curve (black line) for full length chromosome 3 by BF simulations using the same set of parameters defined for chromosome X except that the number of precursors was adjusted in proportion to relative chromosome length (chromosome 3 is 1.5× the length of chromosome X). The CO levels observed experimentally on the chromosome 3 fragment at the different DSB levels were then adjusted to those expected for the full length chromosome under the assumption that CO frequency is proportional to chromosome length, as in all other cases (above). The resulting experimental values were then compared with the theoretical curve and its relatives constructed at varying values of L (grey lines).]

