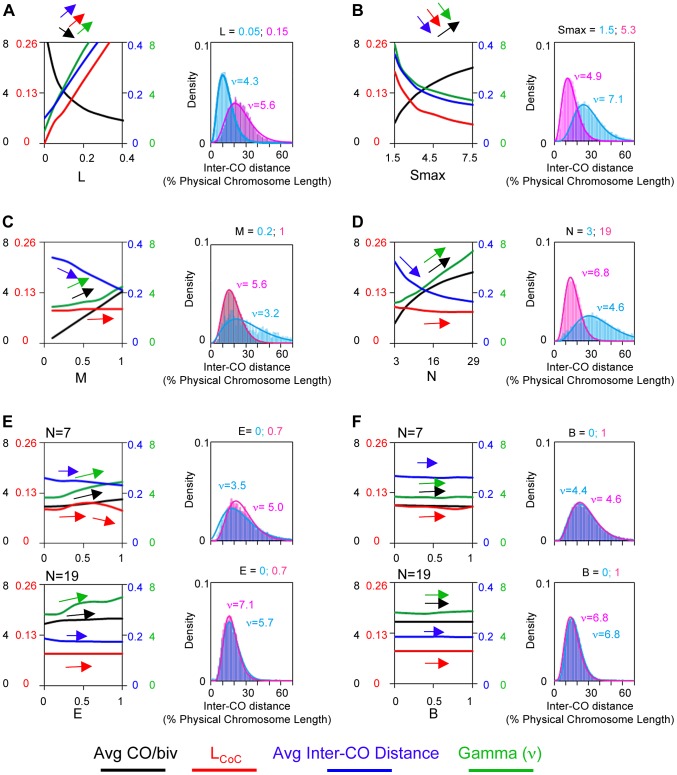
Figure 15. Application of the gamma distribution to CO patterns: Risks and rewards.
The value of the gamma distribution shape parameter (ν) varies not only with variations in interference distance (L) but with variations in other parameters. Notably, the value of ν and the value of the average number of COs per bivalent vary inversely with changes in patterning parameters L and Smax but vary directly, or very little, with changes in precursor and maturation parameters. This is shown by BF simulations performed under standard conditions (Figure 3) except that individual parameters were systematically varied. The values of each of the four indicated descriptors (average CO/bivalent; LCoC; average distance between adjacent COs (“inter-CO distance”) and the gamma distribution shape parameter ν) were plotted as a function of the value of the varied parameter (left). Also, the distribution of distances between adjacent COs for representative values of the varied parameter are shown (right). (A–D) Effects of systematic variation of parameters L, Smax, N and M. (E, F) Effects of variation of E and B at two different values of N.

