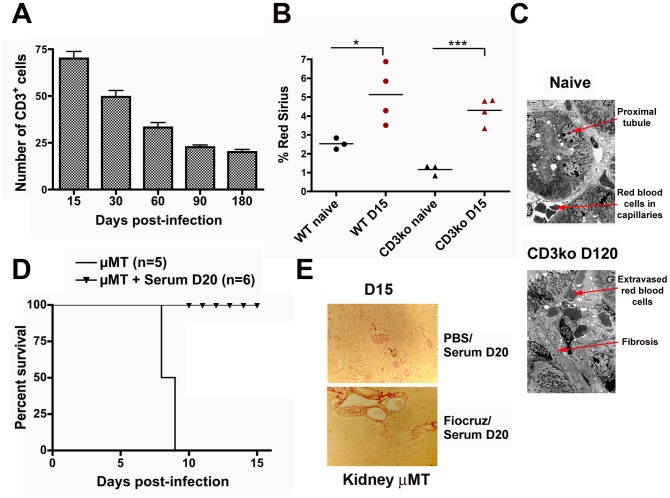
Figure 3. T and B cells are not involved in Leptospira-induced renal fibrosis.
(A) Quantification of the number of infiltrating CD3+ cells in Leptospira-infected kidneys from WT C57BL/6J mice at different time points post p.i.. Values are means ± SD from five kidney sections per surface area from (n = 2) mice at each different time point tested. (B) Percentage of Red Sirius labeling per surface area in kidney sections from WT and CD3ko mice at day-15 p.i. (D15) and in naive mice. The bars represent the mean value in each group. (C) Electron microscopy (magnification ×100) of kidneys sections from a naïve mouse and CD3ko mouse at 4 months p.i. (D120) showing fibrosis. (D) Survival curves and (E) images of renal Red Sirius staining from B cell deficient naïve μMT mice or infected with 107 L. interrogans strain Fiocruz, rescued by immune serum from Leptospira-infected WT mice at day-15 p.i. (D15). *P<0.05; ***P<0.001 between groups.

