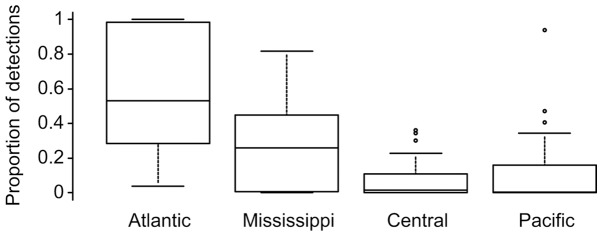
Figure 3. Spatial distribution of detections of the Atlantic flyway duck AIV sub-lineages in North American flyways.

The box plots show the proportions of detections in each of the flyways for the gene sub-lineages that were identified in the 2006–2011 Atlantic flyway duck AIVs. The solid line in the box is the median. The top and bottom of the box are the first and third quartiles, respectively. The upper and lower horizontal lines represent 1.5X the difference between the first and third quartiles and any values falling outside of those are plotted as points. The detailed results for the each segment are provided in Figure S5.
