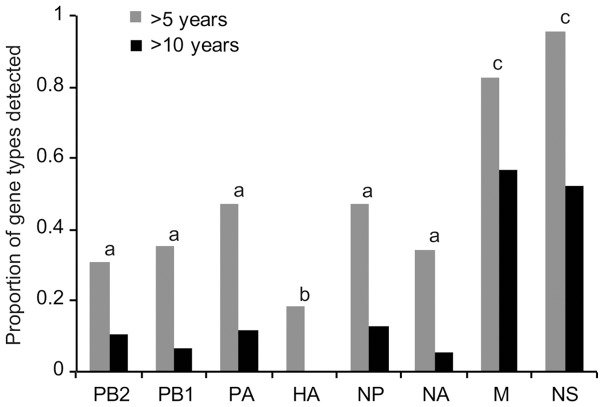
Figure 4. Perpetuation of Atlantic flyway duck AIV gene types across time.
The proportions of gene types identified in the Atlantic flyway viruses that were detected for >5 and >10 years in North America are shown for each segment. There were significant differences among the proportions for the HA, M and NS segments relative to the other segments for >5 years (χ2 = 53.1, df = 7, P<0.0001) and >10 years (χ2 = 66.5, df = 7, P<0.0001). Statistically different proportions for the segments are indicated with different letters (a, b and c).

