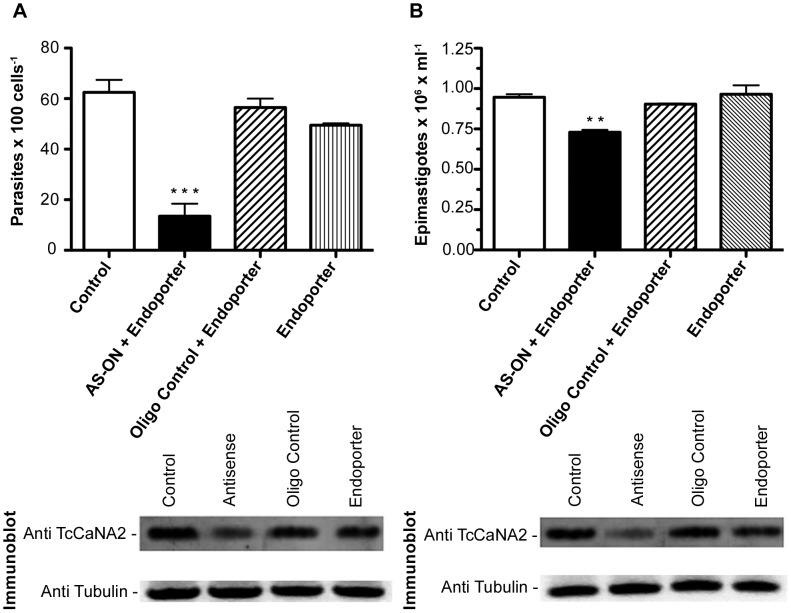
Figure 7. Inhibitory effect of antisense TcCaNA2 oligonucleotides on T. cruzi cell invasion and proliferation.
A) Upper panel: MT treated for 24 h with the AS-ONs directed to TcCaNA2 and then incubated with HeLa cells for 3 h at 37°C. After washes with PBS and staining with May-Grünwald Giemsa, the number of intracellular parasites in a total of 100 cells was counted. Values are the means ± SD of at least three independent experiments performed in triplicate. Statistical significance was determined by the Tukey test (p<0.05) ***p = 0.0008. The lower panel shows the analysis of TcCaNA2 expression in the whole cell lysates detected by immunoblotting with a polyclonal antibody against TcCaNA2. In the lower panel, equal protein loading was checked by immunoblotting with mouse anti-alpha tubulin. B) Upper panel: epimastigotes were cultured in 96-well microplates in the presence or absence of AS-ONs. Cell counts were performed after 72 hours using a Neubauer hemocytometer. Values are the means ± SD of at least three independent experiments performed in triplicate. Statistical significance was determined by the Tukey test (p<0.05) **p = 0.0038. The lower panel shows the analysis of TcCaNA2 expression in the whole cell lysates detected by immunoblotting with a polyclonal antibody against TcCaNA2. In the lower panel equal protein loading was checked by immunoblotting with mouse anti-α tubulin.

