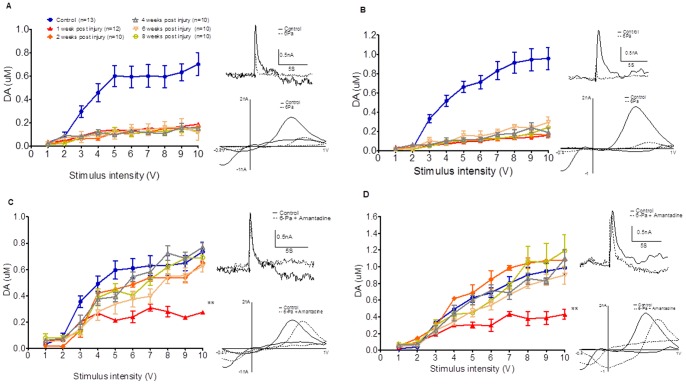
Figure 1. The input/output curves of the evoked dopamine release at 1 (▴, 4 rats, 1 week after injury), 2 (♦, 3 rats, 2weeks after injury), 4 (△, 3 rats, 4 weeks after injury), 6 (□, 3 rats, 6 weeks after injury), and 8 (○, 3 rats, 8 weeks after injury) weeks after injury compared with the control animal group (•) are summarized.
Dopamine release was severely suppressed in the fluid percussion injury group under either 1P (A) or 10P (B) stimulation. Amantadine pumping infusion therapy reversed the dopamine-release deficit 2 weeks later (C, solid square ♦), and the releasing signal even larger than control group under 1 P stimulation (C) at 4 weeks (△, 3 rats, 4 weeks after injury) later and increasing occurred since 2 weeks (♦) after injury at 10 pulses-stimulation (D). The inset panels on the right side show representative cyclic voltammetry (CV) trace (upper) and dopamine signals (lower) (A and B: Control (solid line) vs. 6-Pa group (dotted line) at 8 weeks post injury; C and D: Control (solid line) vs. 6-Pa with amantadine therapy (dotted line) at 8 weeks post injury). (Note: *indicates p<0.05; **indicates p<0.01; and ***indicates p<0.001).

