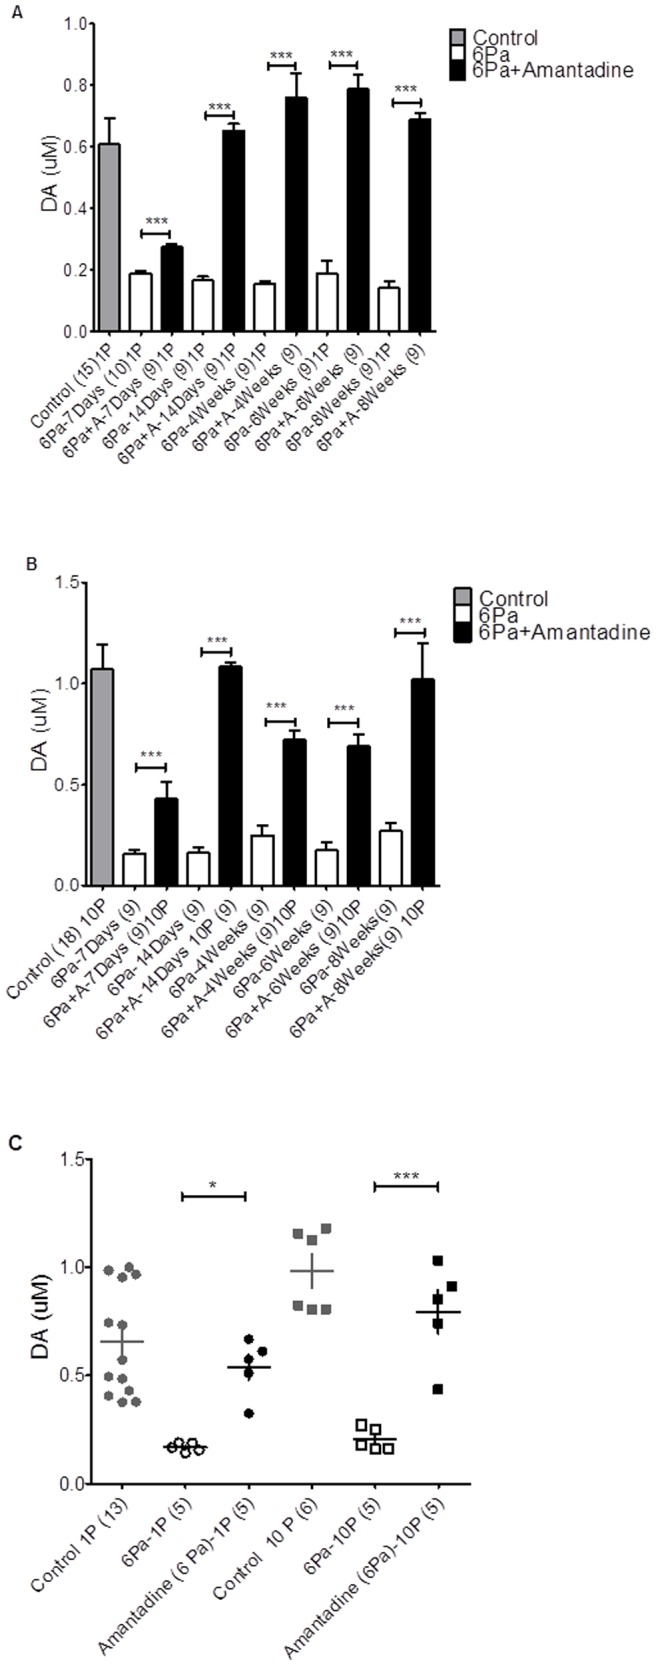
Figure 2. Dopamine signaling values in control and injured animals.

The mean values of dopamine signal evoked by 1 Pulse/25 Hz, 10V stimulation intensity of the 6-Pa-injured group is plotted in panel A, and by 10 Pulses/25 Hz, 10V stimulation intensity of 6-Pa injury group is plotted in panel B. There is a significant suppression in injured animals (open box bar) in each time point compared with the control group (gray bar) (p<0.05*, t-test). In the amantadine therapy group (black bar), the signal decreased initially 1 week later and increased 2 weeks after injury. The maximum value of the signal of dopamine release at each time point after injury in the control (solid circle), 6-Pa-injured (open circle), and amantadine therapy (open square) groups are plotted in panel C, which showed that the significant increase in amantadine therapy animal while comparing with 6-Pa injured animal; and there was no significant difference between control and amantadine therapy group. (Note: *indicates p<0.05; **indicates p<0.01; and ***indicates p<0.001).
