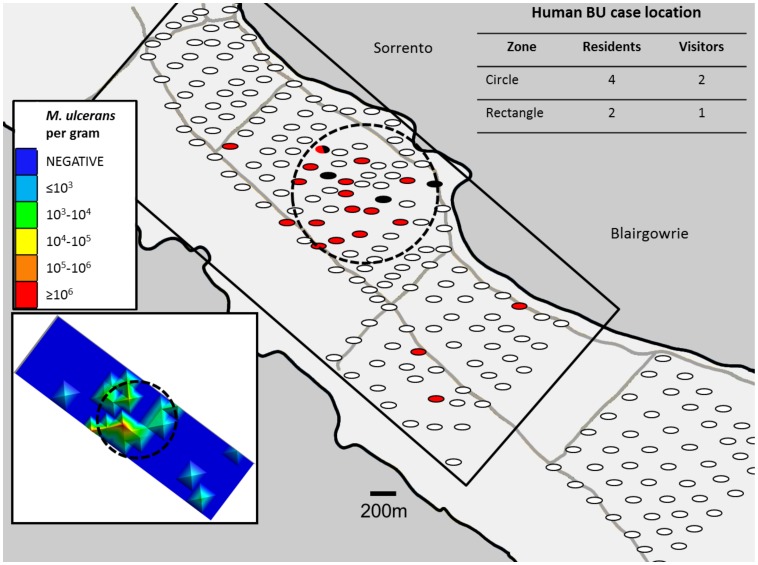
Figure 2. Map showing the distribution of collection sites for possum faeces, indicating the locations of positive samples for Mycobacterium ulcerans DNA by real-time IS2404 PCR.
The locations of positive ringtail faecal samples are shown as red ovals; positive brushtail samples are shown as black ovals: negative samples are shown in white. The dotted circle shows a significant non-random clustering of Mycobacterium ulcerans positive possum faecal samples identified by spatial scan statistics (P<0.0001; 16/30 possum faecal sample positives within a circle of radius 0.42 km). 4/6 residential addresses of human BU cases and 2/3 non-resident addresses fall within the radius of the cluster identified above. Addresses of holiday houses were unavailable for 3 non-resident BU cases. The inset figure (bottom left) depicts a heat map showing possum faecal bacterial loads of samples within the black rectangle, estimated from IS2404 real-time PCR signal strength, ranging from negative (dark blue) to ≥106 M. ulcerans per gram of faeces (red).

