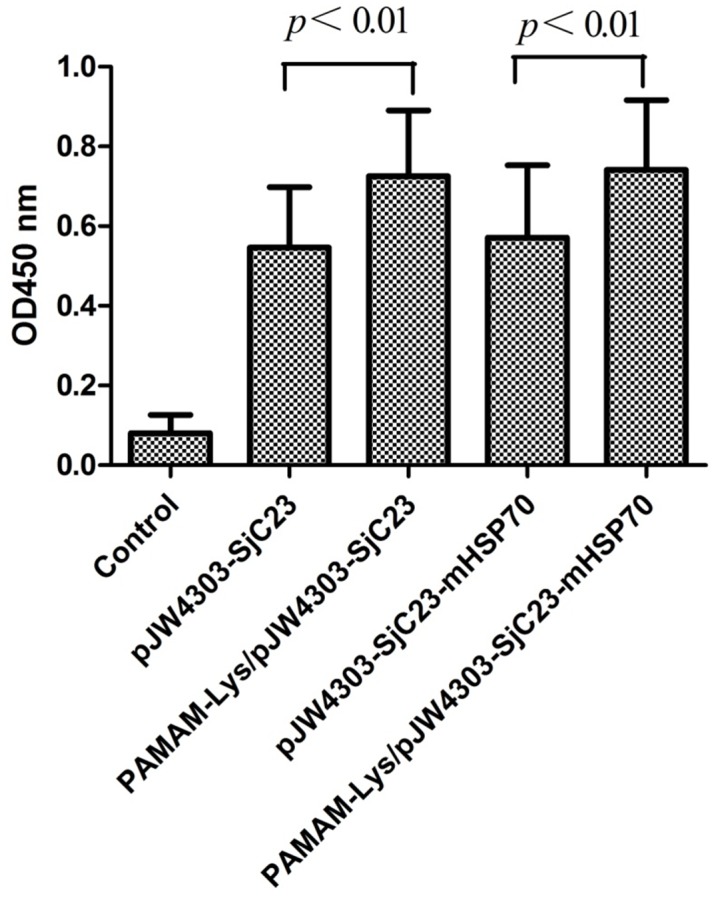
Figure 6. SjC23-specific IgG antibody responses induced by DNA vaccines and empty vector by intramuscular (i.m) immunization.

Data show the average OD values of each group with standard deviations at 1∶100 serum dilution. The serum samples were collected at 4 weeks after the 3rd DNA immunization prior to challenge. Statistical differences are indicated by p values.
