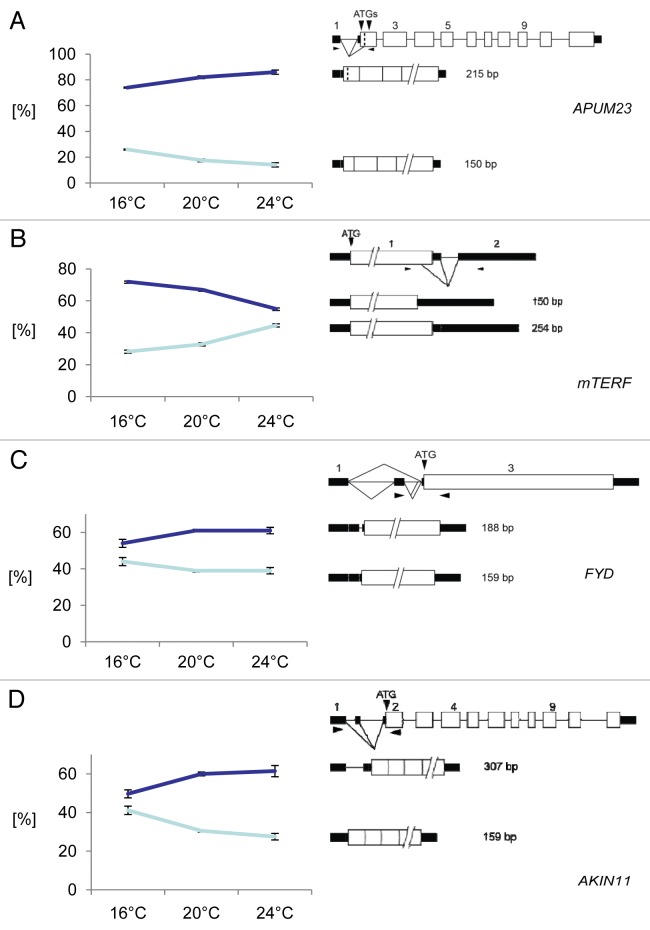
Figure 1: Temperature dependence of AS events that change upon increasing and decreasing ambient temperature. (A) APUM23; (B) mTERF; (C) FYD; (D) AKIN11.The gene structure, the structure of the transcript isoforms around the AS event and the ratios of the two splice isoforms at each temperature are shown. On the left side of each panel, the percentage of each splice form +/− s.d. based on three biological replicates is indicated for each temperature. On the right side of each panel, the gene and transcript structures and the AS events are shown schematically. Exons are indicated by open boxes; UTRs, black rectangles; introns, thin lines; splicing events, diagonal lines. The arrowheads denote the approximate position of primers and the sizes of the PCR products from each splice isoform are indicated.

An official website of the United States government
Here's how you know
Official websites use .gov
A
.gov website belongs to an official
government organization in the United States.
Secure .gov websites use HTTPS
A lock (
) or https:// means you've safely
connected to the .gov website. Share sensitive
information only on official, secure websites.
