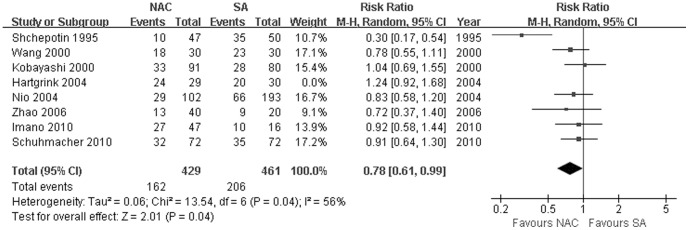
Figure 5. Sensitivity test for total mortality between NAC and SA measurements, showing that there existed significantly lower mortality rate among patients receiving NAC than those undergoing SA when Hartgrink's study was excluded.

The relative weight of each study is proportional to the size of the corresponding box in the Forest plot. NAC, neoadjuvant chemotherapy; SA, surgery alone.
