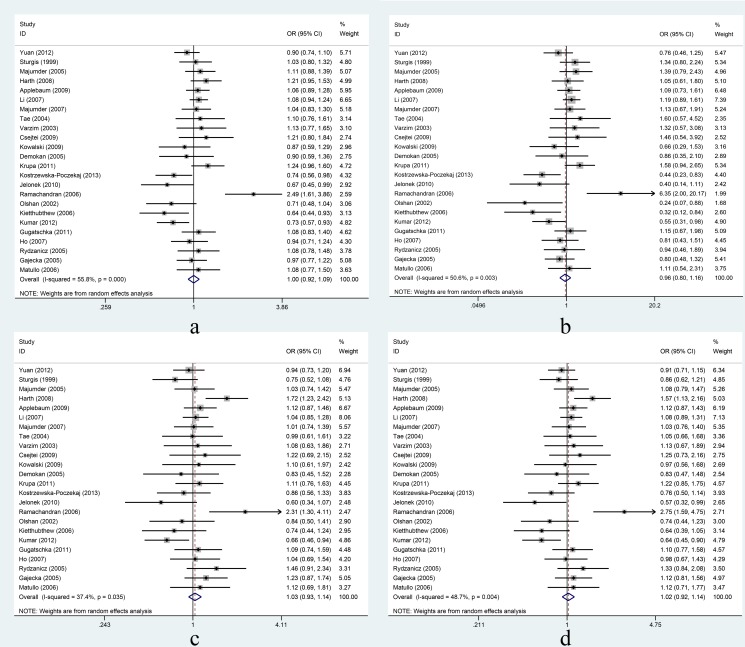
Figure 3. Association between XRCC1 Arg399Gln and risk of head and neck cancer under four genetic models.
Forest plots for a: Gln vs. Arg; b: GlnGln vs. ArgArg; c: ArgGln vs. ArgArg; d: GlnGln+ ArgGln vs. ArgArg. Random-effects models were used for c and d; fixed-effects models were used for a and b. Squares and horizontal lines represent the study-specific OR and 95% CI respectively; diamond indicates the summary OR and 95% CI.

