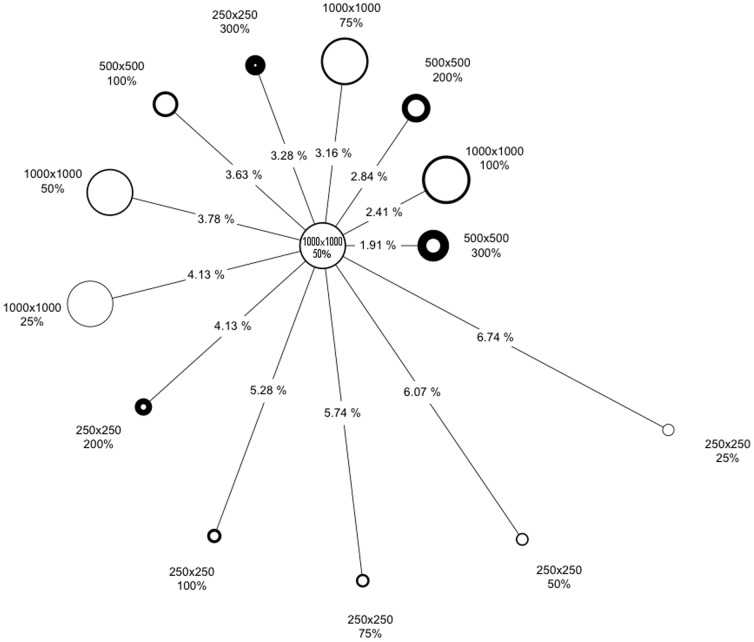
Figure 8. Per-pixel comparison among connectivity mosaics.
Relative difference between the results of a suite of mosaics. The length of each line represents the difference between each mosaic and the mosaic shown in Figure 7; the more different two mosaics are, the farther apart they are placed. The size of a circle denotes the tile size in each mosaic (bigger circles means bigger tiles). The thickness of a circle’s border denotes the size of the buffer used to create the calculation area (thicker means larger buffers).

