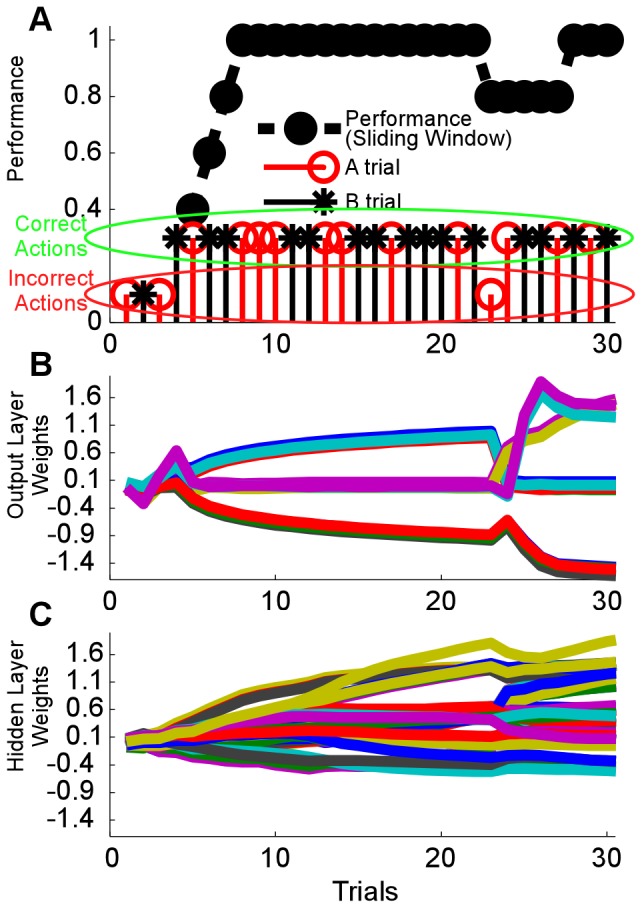
Figure 3. The RLBMI accurately learned to control the robot during closed loop BMI experiments.

(A): stems indicate the sequence of the different trials types (O = A trials, * = B trials) with the stem height indicating whether the robot moved to the correct target (taller stem) or not (shorter stem). The dashed line gives the corresponding accuracy of the RLBMI performance within a five trial sliding window. (B and C) show how throughout every trial the RLBMI system gradually adapted each of the individual weights that connected the hidden layer to the outputs (B) as well as all the weights of the connections between the inputs and the hidden layer (C), as the RLBMI learned to control the robot. The shape of these weight trajectories indicate that the system had arrived at a consistent mapping by the fifth trial: at that point the weight adaptation progresses at a smooth rate and the robot is being moved effectively to the correct targets. At trial 23 an improper robot movement resulted in the weights being quickly adjusted to a modified, but still effective, mapping.
