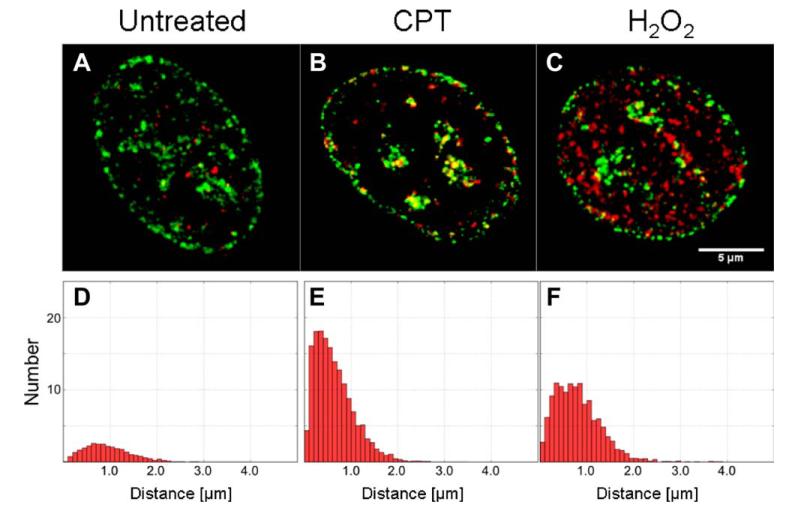
Figure 1.
Images of replication (green) and DNA damage signaling foci (red) in the nuclei of: control (A), and cells treated with Cpt (B), and H2O2 (C). Histograms of nn distances corresponding to populations of these nuclei are shown in the panels D, E, and F, respectively. [Color figure can be viewed in the online issue which is available at wileyonlinelibrary.com.]

