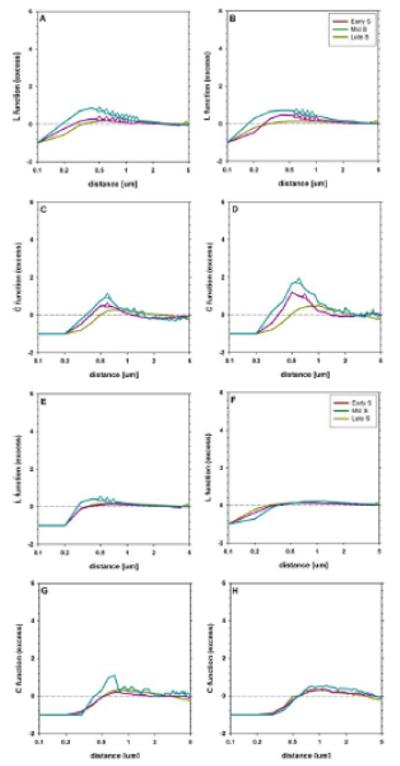
Figure 2.

Patterns of spatial distribution of replication (ABCD) and γH2AX (EFGH) foci in the nuclei of cells treated with Cpt (ACEG) or H2O2 (BDFH). The pattern of autocorrelation was analyzed with L-functions (L′m(d), ABEF) and C-functions (CDGH). The early S-phase is represented with yellow lines, the middle S-phase with magenta and the late S-phase with cyan. The distances corresponding to significant (P < 0.01) difference from 0 (no correlation) are marked with triangles. [Color figure can be viewed in the online issue which is available at wileyonlinelibrary.com.]
