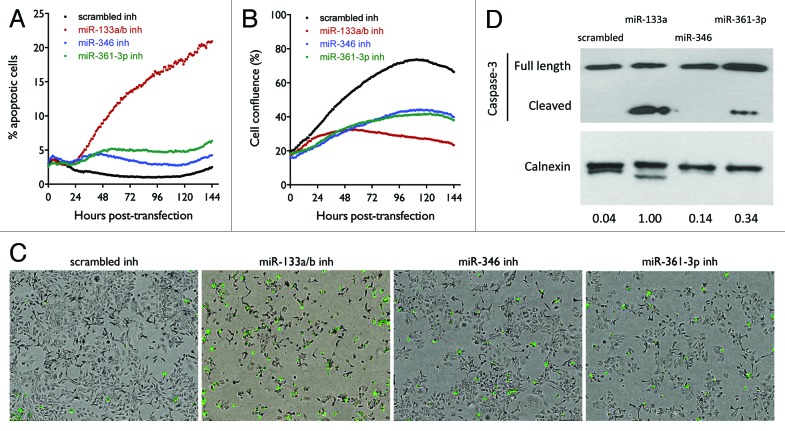
Figure 5. Effect of miR-133a/b, miR-346, and miR-361-3p inhibitors on caspase-3 activation in H1993 cells. (A) Time-dependent effect of the miRNA inhibitors on the induction of cell apoptosis. Cells were transfected with 10 nM of the indicated oligos. Cells undergoing apoptosis were stained using the CellPlayer Caspase-3/7 Reagent (Essen BioScience) and apoptotic events were counted using the IncuCyte live cell imaging system. The percentage of cells induced into apoptosis was calculated by normalizing to total cell numbers quantified by staining for total DNA content. (B) Cell confluence as a function of time was quantified using the IncuCyte live cell imaging system. (C) Representative images at the end point of the apoptotic assay. Apoptotic cells fluoresce green. (D) Western blot analysis of Caspase-3 activation. Cells were transfected with 50 nM of the indicated oligos and incubated for 72 h, after which cell lysates were harvested. Caspase-3 was detected using the specified antibodies, with calnexin levels measured as a loading control. Band intensities were quantified using ImageJ.

An official website of the United States government
Here's how you know
Official websites use .gov
A
.gov website belongs to an official
government organization in the United States.
Secure .gov websites use HTTPS
A lock (
) or https:// means you've safely
connected to the .gov website. Share sensitive
information only on official, secure websites.
