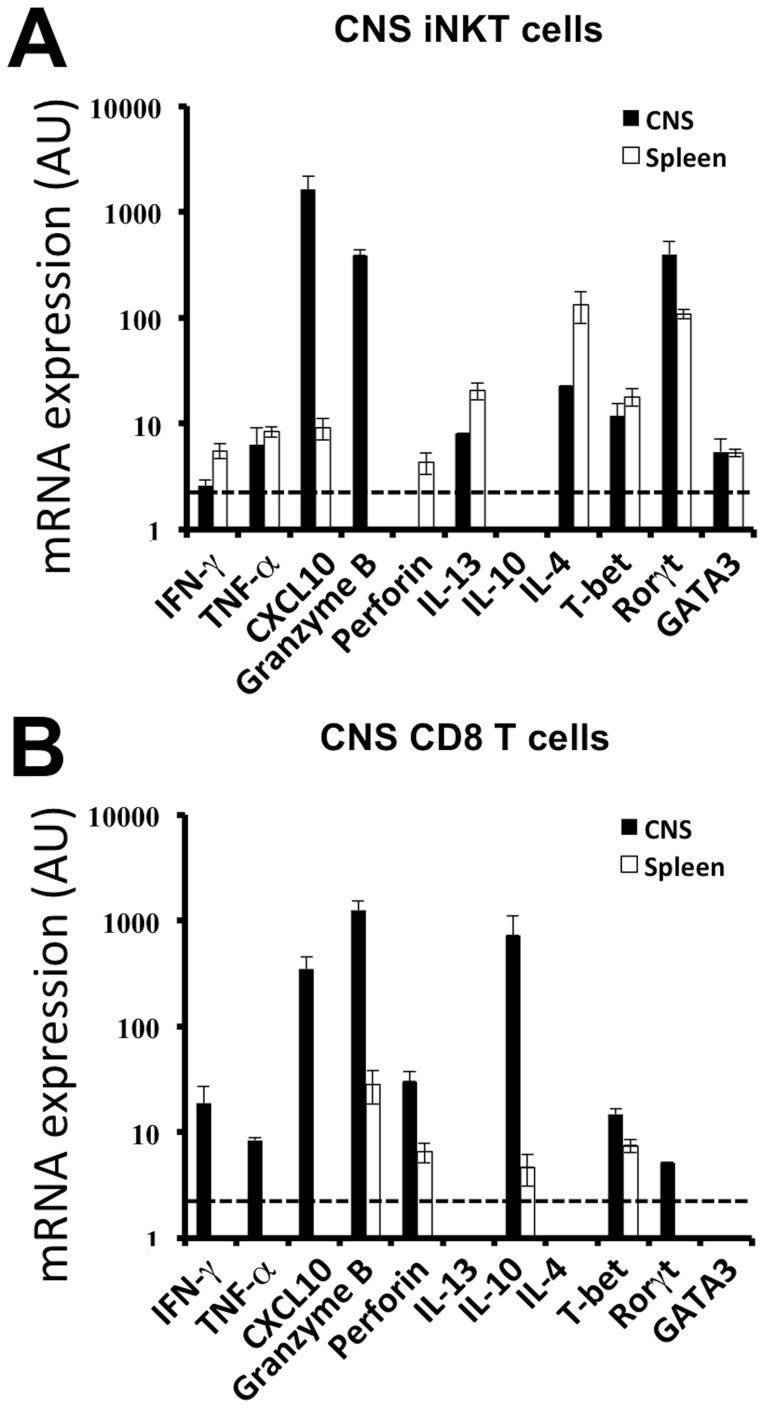
Figure 6. iNKT cells and CD8 T cells in the CNS of TMEV-infected mice express a cytotoxic phenotype.
CD1d:α-GalCer tetramer+ TCRβ+ iNKT cells (A) and TCRβ+ CD8+CD4− (B) T cells were FACS purified from the CNS of Vα14 Tg mice 8 days after TMEV infection. Real-time PCR analysis was performed on mRNA from purified iNKT cells and CD8 T cells from the spleen (white bars) and CNS (black bars). Cells were purified (black bars) from CNS-infiltrating mononuclear cells of 6–8 pooled Vα14 Tg mice or (white bars) from individual spleens. Data represent the mean ± SD of 2 individual experiments (CNS) or the mean of 4 individual mice ± SD (spleen).

