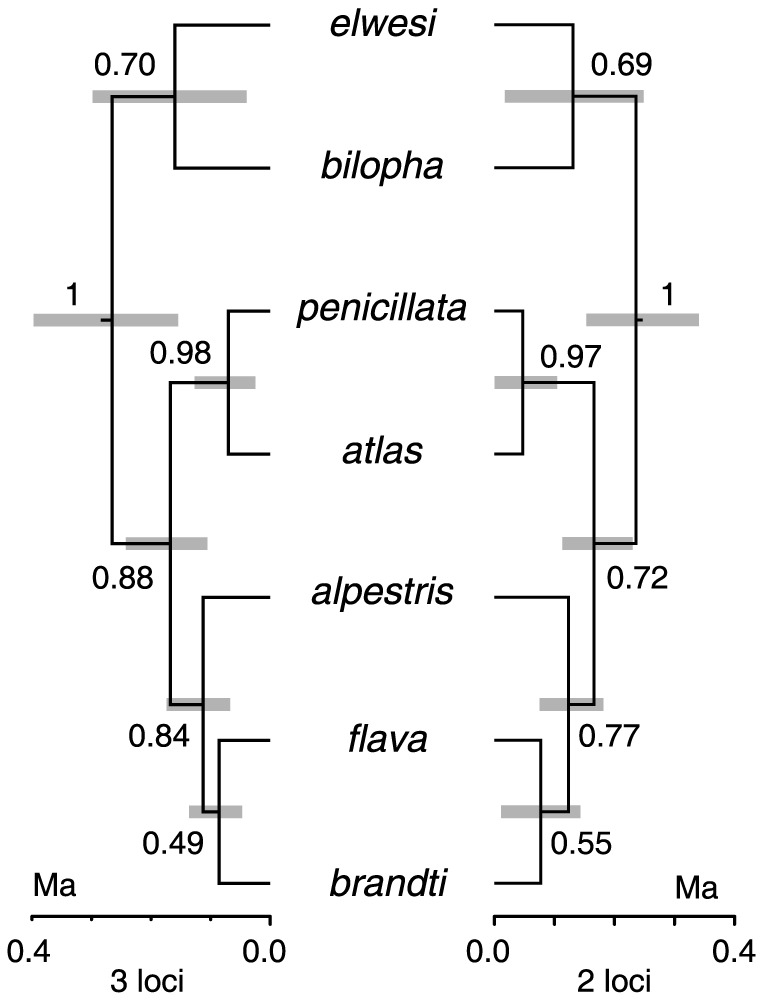
Figure 5. Species trees based on all 3 loci (left) and two nuclear loci (right).

Numbers next to branches show their posterior probability. Gray bars next to nodes indicate their 95% HPD interval for the node age. Scale below each tree indicates time in million years (Ma).
