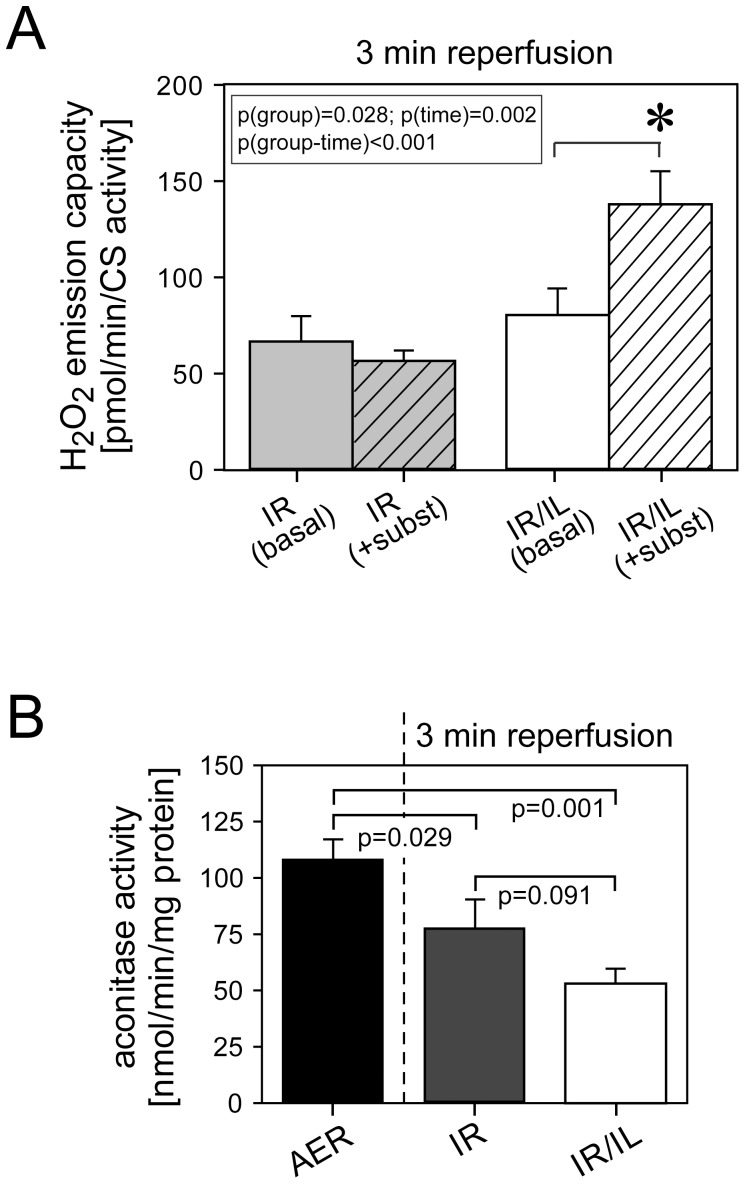
Figure 3. Intralipid®-induced formation of ROS in cardiac fibers collected 3 min after reperfusion.
Panel A: Hydrogen peroxide (H2O2) emission capacity from mitochondria as determined by Amplex Red assay. *significantly different from IR. Panel B: Loss of aconitase activity in Intralipid®-treated hearts (PANOVA = 0.002). IR, untreated hearts exposed to 15 min of ischemia and 3 min of reperfusion (IR). IR/IL, hearts exposed to IR and 1% Intralipid® at the onset of reperfusion. Basal, without substrates. +subst, with added substrates. AER, hearts with time-matched aerobic perfusion. Data are mean (SEM). N = 6 hearts in each group.

