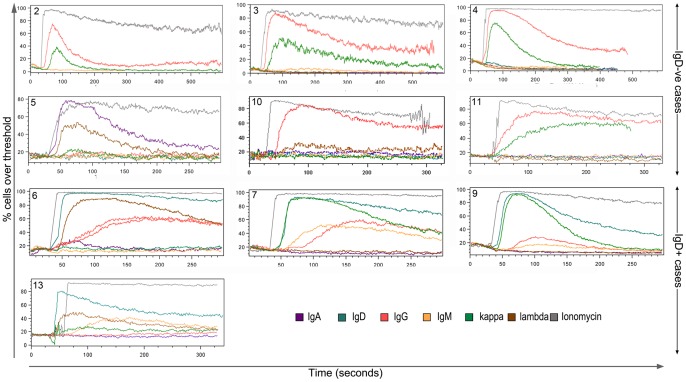
Figure 1. BCR induction of calcium flux is functionally intact in both IgD+ and IgD−ve mult-HCL.
Ca2+ flux was measured in response to goat F(ab’)2 anti-IgH or anti-IgL mediated BCR ligation using the cytoplasmic calcium-indicator dye Fluo3-AM. Unstimulated cells were recorded for 30 seconds prior to addition of goat F(ab’)2 polyclonal anti-Ig. Stimulated cells were then tracked for 5 minutes: cells were gated first on FSC/SSC, then as CD19hiCD11chi for cases 1–9 or as CD19hiCD11chiCD103+ for cases 10–13 prior to analysis of Fluo3-AM fluorescence. The plots here show % cells over threshold where the threshold is the 85th percentile of unstimulated cells. Ionomycin was used as control to achieve maximal Ca2+ flux.

