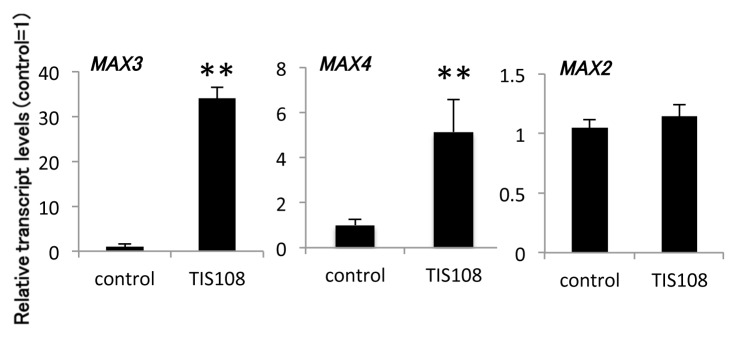
Figure 2. Relative expression of SL-biosynthesis/signaling genes in roots of adult plants. The expression level of each transcript was normalized using UBC (At5g25760) and is displayed relative to the expression level in the control (= 1). The data are mean ± SD of three biological replicates. * and ** Means arestatistically different from that of the wild-type in the control treatment, determined by t-tests (p < 0.05 and p < 0.01, respectively).
