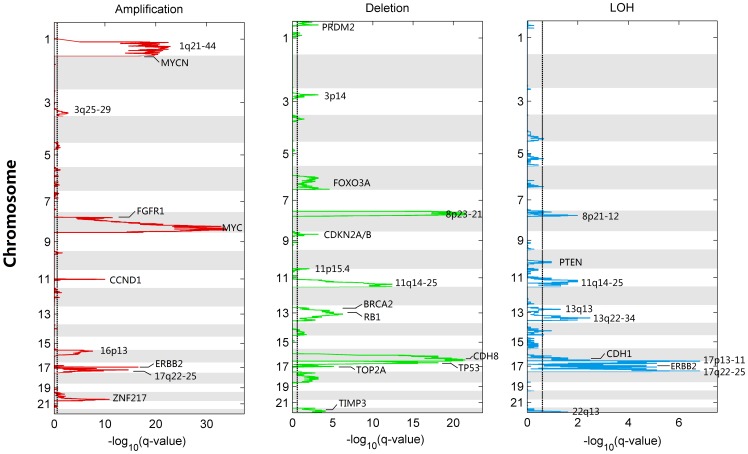
Figure 9. Genome-wide analysis of statistically significant somatic aberrations for breast cancer samples.
112 breast tumor samples are assessed by GIANT for identifying the significant aberrations. Statistical significance for amplification (left panel), deletion (middle panel) and LOH (right panel) was evaluated by using FDR corrected q-value. Dash lines correspond to the significant threshold of 0.25.

