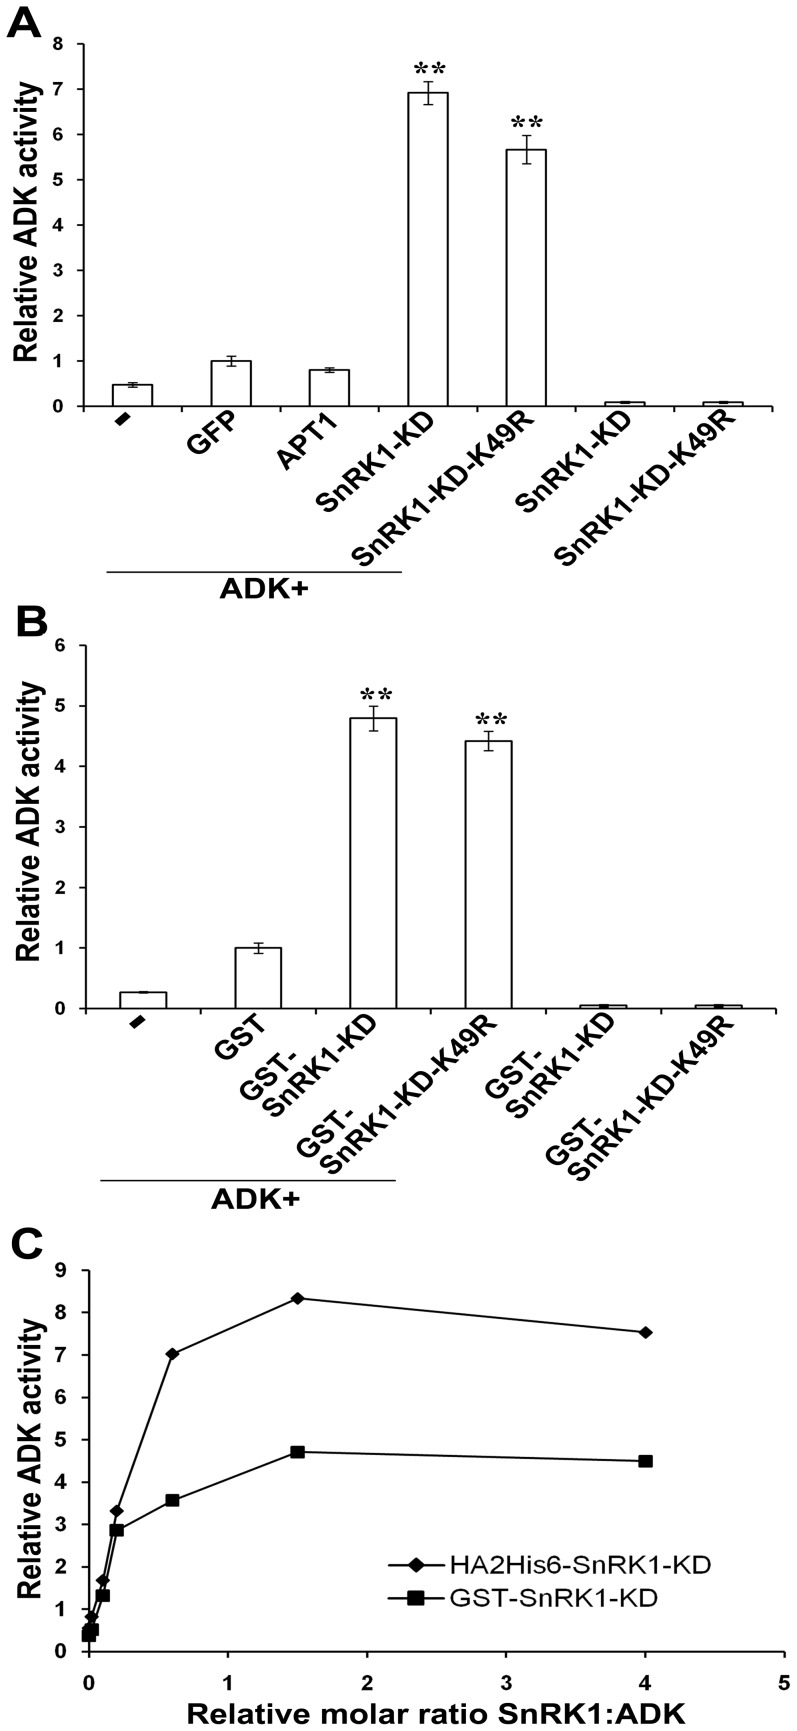
Figure 6. SnRK1-KD and SnRK1-KD-K49R stimulate ADK activity in vitro.
(A) ADK (10 ng) was incubated alone, or with two-fold molar excess of HA2His6-tagged SnRK1-KD, SnRK1-KD-K49R, GFP, or APT1 purified from N. benthamiana. ADK activity was measured and normalized to ADK+GFP. (B) ADK (10 ng) was incubated alone, or with a two-fold molar excess of GST, GST-fused SnRK1-KD, or SnRK1-KD-K49R purified from E. coli. ADK activity was normalized to ADK+GST. In each case, data were obtained from three independent experiments, with two replicates each. Values indicate the mean +/− SE. Asterisks (**) indicate significant differences in ADK activity at 99% confidence, as determined by Student's t test. (C) The graph shows relative ADK activity plotted against increasing SnRK1-KD:ADK ratio. HA2His6-SnRK1-KD (diamonds); GST-SnRK1-KD (squares). The data are representative of three experiments. ADK activity data are presented in Table S4A-C.

